
New Orders and Production Contracting; Backlogs Contracting; Supplier Deliveries Faster; Raw Materials Inventories Growing; Customers’ Inventories Too Low; Prices Decreasing; Exports and Imports Contracting
, /PRNewswire/ — Economic activity in the manufacturing sector contracted in December for the second consecutive month following a 29-month period of growth, say the nation’s supply executives in the latest Manufacturing ISM® Report On Business®.
The report was issued today by Timothy R. Fiore, CPSM, C.P.M., Chair of the Institute for Supply Management® (ISM®) Manufacturing Business Survey Committee:
“The December Manufacturing PMI® registered 48.4 percent, 0.6 percentage point lower than the 49 percent recorded in November. Regarding the overall economy, this figure indicates contraction after 30 straight months of expansion. The Manufacturing PMI® figure is the lowest since May 2020, when it registered 43.5 percent. The New Orders Index remained in contraction territory at 45.2 percent, 2 percentage points lower than the 47.2 percent recorded in November. The Production Index reading of 48.5 percent is a 3-percentage point decrease compared to November’s figure of 51.5 percent. The Prices Index registered 39.4 percent, down 3.6 percentage points compared to the November figure of 43 percent; this is the index’s lowest reading since April 2020 (35.3 percent). The Backlog of Orders Index registered 41.4 percent, 1.4 percentage points higher than the November reading of 40 percent. The Employment Index returned to expansion territory (51.4 percent, up 3 percentage points) after contracting in November (48.4 percent). The Supplier Deliveries Index reading of 45.1 percent is 2.1 percentage points lower than the November figure of 47.2 percent; this is the index’s lowest reading since March 2009 (43.2 percent). The Inventories Index registered 51.8 percent, 0.9 percentage point higher than the November reading of 50.9 percent. The New Export Orders Index reading of 46.2 percent is down 2.2 percentage points compared to November’s figure of 48.4 percent. The Imports Index continued in contraction territory at 45.1 percent, 1.5 percentage points below the November reading of 46.6 percent.”
Fiore continues, “The U.S. manufacturing sector again contracted, with the Manufacturing PMI® at its lowest level since the coronavirus pandemic recovery began. With Business Survey Committee panelists reporting softening new order rates over the previous seven months, the December composite index reading reflects companies’ slowing their output. Demand eased, with the (1) New Orders Index remaining in contraction territory, (2) New Export Orders Index markedly below 50 percent, (3) Customers’ Inventories Index in ‘just right’ territory, and (4) Backlog of Orders Index recovering slightly but still in strong contraction. Output/Consumption (measured by the Production and Employment indexes) was neutral, with a combined zero-percentage point impact on the Manufacturing PMI® calculation. The Employment Index moved back into expansion, and the Production Index dropped into contraction territory. Many panelists’ companies confirm that they are continuing to manage head counts through a combination of hiring freezes, employee attrition and layoffs. Inputs — defined as supplier deliveries, inventories, prices and imports — accommodated future demand growth. The Supplier Deliveries Index indicated faster deliveries, and the Inventories Index expanded at a faster rate as panelists’ companies continued to effectively manage the total supply chain inventory. The Prices Index contracted for the third consecutive month and has declined in each reading since March 2022, when it registered 87.1 percent.
“Of the six biggest manufacturing industries, one — Petroleum & Coal Products — registered moderate growth in December.
“Manufacturing contracted again in December after expanding for 29 straight months. Panelists’ companies continue to judiciously manage hiring. The month-over-month performance of supplier deliveries was the best since March 2009. Average lead time remained 32 percent above previous trough for capital expenditures and 37 percent for purchased materials; both are too high. Managing head counts and total supply chain inventories remain primary goals as the sector closes the year. More attention will be paid to demand as we enter the first quarter to shore up order books for the next six to 12 months,” says Fiore.
The two manufacturing industries that reported growth in December are: Primary Metals; and Petroleum & Coal Products. The 13 industries reporting contraction in December, in the following order, are: Wood Products; Fabricated Metal Products; Chemical Products; Paper Products; Plastics & Rubber Products; Electrical Equipment, Appliances & Components; Furniture & Related Products; Apparel, Leather & Allied Products; Computer & Electronic Products; Machinery; Food, Beverage & Tobacco Products; Transportation Equipment; and Miscellaneous Manufacturing.
WHAT RESPONDENTS ARE SAYING
- “Skilled labor shortages are huge, putting a lot of pressure on existing personnel. Electronic components still a major supply chain issue, particularly if the component you need is not the current hot technology.” [Computer & Electronic Products]
- “Customer demand continues to be depressed. While 2023 pipeline is looking very positive, current demand is significantly down.” [Chemical Products]
- “Orders are really slowing down in the original equipment sector. We haven’t seen a major output decrease because we are still eating away at our back orders.” [Transportation Equipment]
- “Lead times are returning to normal for most of our suppliers, while some of our smaller suppliers are struggling to remain staffed up enough to keep up with orders.” [Food, Beverage & Tobacco Products]
- “The continued uncertainty in the economy has resulted in customers delaying their commitments for capital purchases, which is impacting our fourth quarter sales and lowering our forecast for the first quarter of 2023.” [Machinery]
- “Business is slowing down and forecast to decrease by the end of the first quarter or second quarter.” [Fabricated Metal Products]
- “Trying hard to keep the wheels moving to close out the year strong. The manufacturing plants are nearing their annual outage periods, and some TLC is needed to keep things running.” [Nonmetallic Mineral Products]
- “Finished the year strong, and we are pleased with how the year shaped up.” [Primary Metals]
- “New China technology trade restrictions have impacted our business and plans going forward.” [Electrical Equipment, Appliances & Components]
- “Overall, supply chain conditions have stabilized tremendously since the fourth quarter of 2021. Issues remain, but the list is quite a bit shorter. Customer demand is very strong, and the outlook is positive for 2023. There is large focus on margin recovery after this period of high inflation.” [Miscellaneous Manufacturing]
MANUFACTURING AT A GLANCE December 2022 |
Index | Series Index Dec | Series Index Nov | Percentage Point Change | Direction | Rate of Change | Trend* (Months) |
Manufacturing PMI® | 48.4 | 49.0 | -0.6 | Contracting | Faster | 2 |
New Orders | 45.2 | 47.2 | -2.0 | Contracting | Faster | 4 |
Production | 48.5 | 51.5 | -3.0 | Contracting | From Growing | 1 |
Employment | 51.4 | 48.4 | +3.0 | Growing | From Contracting | 1 |
Supplier Deliveries | 45.1 | 47.2 | -2.1 | Faster | Faster | 3 |
Inventories | 51.8 | 50.9 | +0.9 | Growing | Faster | 17 |
Customers’ Inventories | 48.2 | 48.7 | -0.5 | Too Low | Faster | 75 |
Prices | 39.4 | 43.0 | -3.6 | Decreasing | Faster | 3 |
Backlog of Orders | 41.4 | 40.0 | +1.4 | Contracting | Slower | 3 |
New Export Orders | 46.2 | 48.4 | -2.2 | Contracting | Faster | 5 |
Imports | 45.1 | 46.6 | -1.5 | Contracting | Faster | 2 |
OVERALL ECONOMY | Contracting | From Growing | 1 |
Manufacturing Sector | Contracting | Faster | 2 |
Manufacturing ISM® Report On Business® data is seasonally adjusted for the New Orders, Production, Employment and Inventories indexes.
*Number of months moving in current direction.
COMMODITIES REPORTED UP/DOWN IN PRICE AND IN SHORT SUPPLY
Commodities Up in PriceCopper; Electrical Components (2); Electricity (2); Electronic Components (25); Freight*; Labor — Temporary (4); Semiconductors; and Zinc.
Commodities Down in PriceAluminum (8); Aluminum Products; Corrugate; Crude Oil; Diesel; Freight* (2); Natural Gas; Ocean Freight (4); Plastic Resins (7); Polyethylene; Polypropylene (5); Solvents; Steel (8); Steel — Cold Rolled; Steel — Hot Rolled (8); Steel — Stainless Steel Products; Steel Bars; and Steel Products (6).
Commodities in Short SupplyBearings; Electrical Components (27); Electronic Components (25); Hydraulic Components (8); Labor — Temporary; Rubber Based Products (2); Semiconductors (25); Steel Products (2); Tyvek; and Wire Harnesses.
Note: The number of consecutive months the commodity is listed is indicated after each item.
*Indicates both up and down in price.
DECEMBER 2022 MANUFACTURING INDEX SUMMARIES
Manufacturing PMI®The U.S. manufacturing sector contracted in December, as the Manufacturing PMI® registered 48.4 percent, 0.6 percentage point below the reading of 49 percent recorded in November. “This is the second month of contraction and, as predicted, will likely be the norm for the PMI® at least through the first quarter of 2023, with the PMI® expected to be between 48 and 52 percent. Of the five subindexes that directly factor into the Manufacturing PMI®, two (Employment and Inventories) were in growth territory, with both gaining a bit of ground. The PMI® registered its lowest level since May 2020, when the index was 43.5 percent. Of the six biggest manufacturing industries, only Petroleum & Coal Products registered moderate growth in December. The Production Index decreased 3 percentage points, falling into contraction territory. Supply chain congestion continued to ease, indicated by the Supplier Deliveries Index showing faster deliveries. Only two of the 10 subindexes were positive for the period,” says Fiore. A reading above 50 percent indicates that the manufacturing sector is generally expanding; below 50 percent indicates that it is generally contracting.
A Manufacturing PMI® above 48.7 percent, over a period of time, generally indicates an expansion of the overall economy. Therefore, the December Manufacturing PMI® indicates the overall economy contracted in December after 30 consecutive months of expansion following contraction in April and May 2020. “The past relationship between the Manufacturing PMI® and the overall economy indicates that the Manufacturing PMI® for December (48.4 percent) corresponds to a 0.1-percent decrease in real gross domestic product (GDP) on an annualized basis,” says Fiore.
THE LAST 12 MONTHS
Month | Manufacturing PMI® | Month | Manufacturing PMI® |
Dec 2022 | 48.4 | Jun 2022 | 53.0 |
Nov 2022 | 49.0 | May 2022 | 56.1 |
Oct 2022 | 50.2 | Apr 2022 | 55.4 |
Sep 2022 | 50.9 | Mar 2022 | 57.1 |
Aug 2022 | 52.8 | Feb 2022 | 58.6 |
Jul 2022 | 52.8 | Jan 2022 | 57.6 |
Average for 12 months – 53.5 High – 58.6 Low – 48.4 |
New OrdersISM®’s New Orders Index contracted for the fourth consecutive month in December, registering 45.2 percent, a decrease of 2 percentage points compared to the 47.2 percent reported in November. “Of the six largest manufacturing sectors, only Transportation Equipment reported increased new orders. Price and lead time declines as well as backlog contraction should encourage buyers to reenter the market and sales agents to be more aggressive in seeking new business, but clearly this did not occur in December. Slowing in new order rates to adjust for overordering in 2021 and the first quarter of 2022 has been underway since March of this year,” says Fiore. (For more on lead times, see the Buying Policy section of this report.) A New Orders Index above 52.9 percent, over time, is generally consistent with an increase in the Census Bureau’s series on manufacturing orders (in constant 2000 dollars).
Of the 18 manufacturing industries, three reported growth in new orders in December: Textile Mills; Primary Metals; and Transportation Equipment. Eleven industries reported a decline in new orders in December, in the following order: Wood Products; Nonmetallic Mineral Products; Fabricated Metal Products; Food, Beverage & Tobacco Products; Chemical Products; Furniture & Related Products; Plastics & Rubber Products; Electrical Equipment, Appliances & Components; Miscellaneous Manufacturing; Computer & Electronic Products; and Machinery.
New Orders | %Higher | %Same | %Lower | Net | Index |
Dec 2022 | 15.8 | 52.7 | 31.5 | -15.7 | 45.2 |
Nov 2022 | 12.7 | 62.3 | 25.0 | -12.3 | 47.2 |
Oct 2022 | 18.3 | 56.4 | 25.3 | -7.0 | 49.2 |
Sep 2022 | 16.0 | 62.8 | 21.2 | -5.2 | 47.1 |
ProductionThe Production Index registered 48.5 percent in December, 3 percentage points lower than the November reading of 51.5 percent, indicating contraction after 30 consecutive months of growth. “Of the top six industries, only two — Transportation Equipment; and Machinery — expanded in December. The Production Index contraction is a strong indicator that backlog reduction is not sufficient to maintain production growth. Additionally, as customers inventories have reached ‘about right’ levels, panelists are now concerned about future production potential,” says Fiore. An index above 52.4 percent, over time, is generally consistent with an increase in the Federal Reserve Board’s Industrial Production figures.
The four industries reporting growth in production during the month of December are: Primary Metals; Electrical Equipment, Appliances & Components; Transportation Equipment; and Machinery. The eight industries reporting a decrease in production in December — in the following order — are: Chemical Products; Wood Products; Paper Products; Fabricated Metal Products; Furniture & Related Products; Plastics & Rubber Products; Miscellaneous Manufacturing; and Computer & Electronic Products. Six industries reported no change in production.
Production | %Higher | %Same | %Lower | Net | Index |
Dec 2022 | 17.3 | 56.2 | 26.5 | -9.2 | 48.5 |
Nov 2022 | 20.2 | 61.7 | 18.1 | +2.1 | 51.5 |
Oct 2022 | 20.2 | 62.3 | 17.5 | +2.7 | 52.3 |
Sep 2022 | 17.5 | 64.3 | 18.2 | -0.7 | 50.6 |
EmploymentISM®‘s Employment Index registered 51.4 percent in December, 3 percentage points higher than the November reading of 48.4 percent. “The index indicated employment expanded after contracting for one month. Of the six big manufacturing sectors, only two (Petroleum & Coal Products; and Machinery) expanded. Labor management sentiment continued to shift, with a number of panelists’ companies reducing employment levels through hiring freezes, attrition — and since November — layoffs. In December, layoffs were mentioned in 11 percent of employment comments, down from 14 percent in November, likely due to the holiday period. Turnover rates improved marginally, recording their lowest level (27 percent of comments) since tracking began in June 2021. For those companies expanding their workforces, comments continue to support an improving hiring environment,” says Fiore. An Employment Index above 50.5 percent, over time, is generally consistent with an increase in the Bureau of Labor Statistics (BLS) data on manufacturing employment.
Of 18 manufacturing industries, five reported employment growth in December: Petroleum & Coal Products; Furniture & Related Products; Plastics & Rubber Products; Machinery; and Miscellaneous Manufacturing. The six industries reporting a decrease in employment in December — in the following order — are: Textile Mills; Wood Products; Primary Metals; Electrical Equipment, Appliances & Components; Computer & Electronic Products; and Food, Beverage & Tobacco Products. Seven industries reported no change in employment in December compared to November.
Employment | %Higher | %Same | %Lower | Net | Index |
Dec 2022 | 15.6 | 67.5 | 16.9 | -1.3 | 51.4 |
Nov 2022 | 12.8 | 70.6 | 16.6 | -3.8 | 48.4 |
Oct 2022 | 16.0 | 68.9 | 15.1 | +0.9 | 50.0 |
Sep 2022 | 17.5 | 60.3 | 22.2 | -4.7 | 48.7 |
Supplier Deliveries†The delivery performance of suppliers to manufacturing organizations was faster for a third straight month in December, as the Supplier Deliveries Index registered 45.1 percent, 2.1 percentage points lower than the 47.2 percent reported in November. This reading indicates the fastest supplier delivery performance in 165 months (March 2009, when the index registered 43.2 percent). Of the top six manufacturing industries, only Food, Beverage & Tobacco Products reported slower deliveries. “In December, 88 percent of panelists reported ‘same’ or ‘faster’ delivery times. Panelists’ comments overwhelmingly confirmed that suppliers performed better in December compared to previous months, continuing an improvement trend that began in May 2022,” says Fiore. A reading below 50 percent indicates faster deliveries, while a reading above 50 percent indicates slower deliveries.
Three of 18 manufacturing industries reported slower supplier deliveries in December: Textile Mills; Miscellaneous Manufacturing; and Food, Beverage & Tobacco Products. The 10 industries reporting faster supplier deliveries in December as compared to November — in the following order — are: Paper Products; Plastics & Rubber Products; Wood Products; Electrical Equipment, Appliances & Components; Fabricated Metal Products; Machinery; Primary Metals; Chemical Products; Computer & Electronic Products; and Transportation Equipment.
Supplier Deliveries | %Slower | %Same | %Faster | Net | Index |
Dec 2022 | 12.3 | 65.6 | 22.1 | -9.8 | 45.1 |
Nov 2022 | 13.9 | 66.5 | 19.6 | -5.7 | 47.2 |
Oct 2022 | 11.7 | 70.2 | 18.1 | -6.4 | 46.8 |
Sep 2022 | 16.8 | 71.2 | 12.0 | +4.8 | 52.4 |
InventoriesThe Inventories Index registered 51.8 percent in December, 0.9 percentage point higher than the 50.9 percent reported for November. “Manufacturing inventories expanded at a faster rate compared to November. Of the six big manufacturing industries, two (Food, Beverage & Tobacco Products; and Computer & Electronic Products) increased manufacturing raw material inventories in December. Panelists’ companies continue their efforts to reduce their total supply chain inventories in preparation for a further economic slowdown, indicated by the contraction in new orders, slow expansion in manufacturing inventories and the ‘just right’ level of customers’ inventories,” says Fiore. An Inventories Index greater than 44.4 percent, over time, is generally consistent with expansion in the Bureau of Economic Analysis (BEA) figures on overall manufacturing inventories (in chained 2000 dollars).
Of 18 manufacturing industries, the eight reporting higher inventories in December — in the following order — are: Nonmetallic Mineral Products; Paper Products; Primary Metals; Electrical Equipment, Appliances & Components; Plastics & Rubber Products; Food, Beverage & Tobacco Products; Miscellaneous Manufacturing; and Computer & Electronic Products. The six industries reporting contracting inventories in December — in the following order — are: Apparel, Leather & Allied Products; Fabricated Metal Products; Furniture & Related Products; Chemical Products; Machinery; and Transportation Equipment.
Inventories | %Higher | %Same | %Lower | Net | Index |
Dec 2022 | 20.0 | 59.5 | 20.5 | -0.5 | 51.8 |
Nov 2022 | 20.9 | 58.3 | 20.8 | +0.1 | 50.9 |
Oct 2022 | 21.6 | 63.3 | 15.1 | +6.5 | 52.5 |
Sep 2022 | 23.0 | 64.9 | 12.1 | +10.9 | 55.5 |
Customers’ Inventories†ISM®‘s Customers’ Inventories Index registered 48.2 percent in December, 0.5 percentage point lower than the 48.7 percent reported for November. “Customers’ inventory levels are considered ‘just right.’ The current index level continues to no longer provide positive support to future manufacturing expansion,” says Fiore.
Five industries reported customers’ inventories as too high in December: Paper Products; Furniture & Related Products; Wood Products; Computer & Electronic Products; and Electrical Equipment, Appliances & Components. The seven industries reporting customers’ inventories as too low in December — listed in order — are: Machinery; Chemical Products; Transportation Equipment; Primary Metals; Plastics & Rubber Products; Food, Beverage & Tobacco Products; and Fabricated Metal Products. Six industries reported no change in customers’ inventories in December compared to November.
Customers’ Inventories | % Reporting | %Too High | %About Right | %Too Low | Net | Index |
Dec 2022 | 78 | 15.2 | 66.0 | 18.8 | -3.6 | 48.2 |
Nov 2022 | 77 | 20.6 | 56.2 | 23.2 | -2.6 | 48.7 |
Oct 2022 | 74 | 13.4 | 56.3 | 30.3 | -16.9 | 41.6 |
Sep 2022 | 73 | 13.5 | 56.1 | 30.4 | -16.9 | 41.6 |
Prices†The ISM® Prices Index registered 39.4 percent in December, 3.6 percentage points lower compared to the November reading of 43 percent, indicating raw materials prices decreased for the third straight month after a 28-month period in “increasing” territory. This is the index’s lowest level since a reading of 35.3 percent in April 2020. Over the past nine months, the index has decreased 47.7 percentage points, including a combined 26-percentage point plunge in July and August. None of the top six manufacturing industries reported increases in prices in December. “Price declines continue to be driven by relaxation in energy markets, steel, aluminum, chemicals, plastics, corrugate as well as lower freight costs. Notably, 86 percent of respondents reported paying the same or lower prices in December, compared to 87 percent in November, continuing the declining price trend,” says Fiore. A Prices Index above 52.6 percent, over time, is generally consistent with an increase in the Bureau of Labor Statistics (BLS) Producer Price Index for Intermediate Materials.
In December, only one industry reported paying increased prices for raw materials: Apparel, Leather & Allied Products. The 10 industries reporting paying decreased prices for raw materials in December — in the following order — are: Textile Mills; Wood Products; Petroleum & Coal Products; Fabricated Metal Products; Transportation Equipment; Plastics & Rubber Products; Furniture & Related Products; Chemical Products; Food, Beverage & Tobacco Products; and Machinery. Seven industries reported no change in prices in December compared to November.
Prices | %Higher | %Same | %Lower | Net | Index |
Dec 2022 | 13.6 | 51.6 | 34.8 | -21.2 | 39.4 |
Nov 2022 | 13.1 | 59.8 | 27.1 | -14.0 | 43.0 |
Oct 2022 | 19.7 | 53.8 | 26.5 | -6.8 | 46.6 |
Sep 2022 | 31.4 | 40.5 | 28.1 | +3.3 | 51.7 |
Backlog of Orders†ISM®‘s Backlog of Orders Index registered 41.4 percent in December, a 1.4-percentage point increase compared to November’s reading of 40 percent, indicating order backlogs contracted for the third consecutive month after a 27-month period of expansion. Of the six largest manufacturing sectors, only one — Machinery, which is capital equipment intensive — expanded order backlogs in December. “Backlogs contracted again at a significant rate, as weak new order levels negatively impacted manufacturing books of business. Many panelists indicated that they were working off backlog (overdue orders) as new order rates continue to soften,” says Fiore. “The index recorded its lowest level since May 2020, when it registered 38.2 percent.”
Two industries reported growth in order backlogs in December: Textile Mills; and Machinery. Twelve industries reported lower backlogs in December, in the following order: Wood Products; Paper Products; Electrical Equipment, Appliances & Components; Plastics & Rubber Products; Fabricated Metal Products; Furniture & Related Products; Food, Beverage & Tobacco Products; Primary Metals; Chemical Products; Miscellaneous Manufacturing; Computer & Electronic Products; and Transportation Equipment.
Backlog of Orders | % Reporting | %Higher | %Same | %Lower | Net | Index |
Dec 2022 | 93 | 11.5 | 59.7 | 28.8 | -17.3 | 41.4 |
Nov 2022 | 91 | 13.7 | 52.6 | 33.7 | -20.0 | 40.0 |
Oct 2022 | 93 | 17.4 | 55.8 | 26.8 | -9.4 | 45.3 |
Sep 2022 | 90 | 25.5 | 50.8 | 23.7 | +1.8 | 50.9 |
New Export Orders†ISM®‘s New Export Orders Index registered 46.2 percent in December, 2.2 percentage points lower than the November reading of 48.4 percent. “The New Export Orders Index contracted in December for the fifth consecutive month after 25 straight months in expansion territory. Continued weakness in European economies and China’s economic sluggishness continued to constrain new export order activity, which negatively impacts new order rates,” says Fiore.
Five industries reported growth in new export orders in December: Wood Products; Apparel, Leather & Allied Products; Plastics & Rubber Products; Electrical Equipment, Appliances & Components; and Miscellaneous Manufacturing. The five industries reporting a decrease in new export orders in December are: Fabricated Metal Products; Chemical Products; Food, Beverage & Tobacco Products; Computer & Electronic Products; and Machinery. Seven industries reported no change in new export orders in December compared to November.
New Export Orders | % Reporting | %Higher | %Same | %Lower | Net | Index |
Dec 2022 | 72 | 5.6 | 81.2 | 13.2 | -7.6 | 46.2 |
Nov 2022 | 72 | 11.2 | 74.4 | 14.4 | -3.2 | 48.4 |
Oct 2022 | 73 | 6.7 | 79.5 | 13.8 | -7.1 | 46.5 |
Sep 2022 | 72 | 9.4 | 76.7 | 13.9 | -4.5 | 47.8 |
Imports†ISM®‘s Imports Index registered 45.1 percent in December, a decrease of 1.5 percentage points compared to November’s figure of 46.6 percent. “The index remained in contraction in December after a recent five-month period of expansion, dropping to its lowest level since May 2020 (41.3 percent). Panelists’ comments indicate that the index contraction is a combination of sluggish demand as well as effects from China’s zero-COVID policy. At present, there is little indication that the latter issue is affecting U.S. output,” says Fiore.
The only industry reporting growth in imports in December is Computer & Electronic Products. Eight industries reported lower volumes of imports in December, in the following order: Paper Products; Wood Products; Primary Metals; Plastics & Rubber Products; Chemical Products; Fabricated Metal Products; Electrical Equipment, Appliances & Components; and Miscellaneous Manufacturing. Nine industries reported no change in imports in December.
Imports | % Reporting | %Higher | %Same | %Lower | Net | Index |
Dec 2022 | 85 | 7.3 | 75.6 | 17.1 | -9.8 | 45.1 |
Nov 2022 | 84 | 10.2 | 72.8 | 17.0 | -6.8 | 46.6 |
Oct 2022 | 84 | 9.3 | 82.9 | 7.8 | +1.5 | 50.8 |
Sep 2022 | 83 | 15.2 | 74.8 | 10.0 | +5.2 | 52.6 |
†The Supplier Deliveries, Customers’ Inventories, Prices, Backlog of Orders, New Export Orders, and Imports indexes do not meet the accepted criteria for seasonal adjustments.
Buying PolicyThe average commitment lead time for Capital Expenditures in December was 171 days, a decrease of six days compared to November. Average lead time in December for Production Materials was 85 days, an increase of one day. Average lead time for Maintenance, Repair and Operating (MRO) Supplies was 47 days, an increase of three days.
Percent Reporting |
Capital Expenditures | Hand-to- Mouth | 30 Days | 60 Days | 90 Days | 6 Months | 1 Year+ | Average Days |
Dec 2022 | 16 | 6 | 7 | 12 | 33 | 26 | 171 |
Nov 2022 | 16 | 4 | 8 | 11 | 33 | 28 | 177 |
Oct 2022 | 16 | 6 | 6 | 12 | 30 | 30 | 179 |
Sep 2022 | 16 | 5 | 7 | 11 | 32 | 29 | 178 |
Percent Reporting |
Production Materials | Hand-to- Mouth | 30 Days | 60 Days | 90 Days | 6 Months | 1 Year+ | Average Days |
Dec 2022 | 11 | 19 | 28 | 25 | 12 | 5 | 85 |
Nov 2022 | 8 | 23 | 25 | 27 | 13 | 4 | 84 |
Oct 2022 | 8 | 21 | 26 | 25 | 13 | 7 | 93 |
Sep 2022 | 9 | 24 | 24 | 22 | 13 | 8 | 94 |
Percent Reporting |
MRO Supplies | Hand-to- Mouth | 30 Days | 60 Days | 90 Days | 6 Months | 1 Year+ | Average Days |
Dec 2022 | 29 | 33 | 17 | 16 | 4 | 1 | 47 |
Nov 2022 | 30 | 34 | 17 | 15 | 3 | 1 | 44 |
Oct 2022 | 27 | 36 | 16 | 15 | 5 | 1 | 48 |
Sep 2022 | 26 | 35 | 19 | 15 | 4 | 1 | 48 |
About This ReportDO NOT CONFUSE THIS NATIONAL REPORT with the various regional purchasing reports released across the country. The national report’s information reflects the entire U.S., while the regional reports contain primarily regional data from their local vicinities. Also, the information in the regional reports is not used in calculating the results of the national report. The information compiled in this report is for the month of December 2022.
The data presented herein is obtained from a survey of manufacturing supply executives based on information they have collected within their respective organizations. ISM® makes no representation, other than that stated within this release, regarding the individual company data collection procedures. The data should be compared to all other economic data sources when used in decision-making.
Data and Method of PresentationThe Manufacturing ISM® Report On Business® is based on data compiled from purchasing and supply executives nationwide. The composition of the Manufacturing Business Survey Committee is stratified according to the North American Industry Classification System (NAICS) and each of the following NAICS-based industry’s contribution to gross domestic product (GDP): Food, Beverage & Tobacco Products; Textile Mills; Apparel, Leather & Allied Products; Wood Products; Paper Products; Printing & Related Support Activities; Petroleum & Coal Products; Chemical Products; Plastics & Rubber Products; Nonmetallic Mineral Products; Primary Metals; Fabricated Metal Products; Machinery; Computer & Electronic Products; Electrical Equipment, Appliances & Components; Transportation Equipment; Furniture & Related Products; and Miscellaneous Manufacturing (products such as medical equipment and supplies, jewelry, sporting goods, toys and office supplies). The data are weighted based on each industry’s contribution to GDP. According to the BEA estimates for 2020 GDP (released December 22, 2021), the six largest manufacturing subsectors are: Computer & Electronic Products; Chemical Products; Transportation Equipment; Petroleum & Coal Products; Food, Beverage & Tobacco Products; and Machinery. Beginning in February 2018 with January 2018 data, computation of the indexes is accomplished utilizing unrounded numbers.
Survey responses reflect the change, if any, in the current month compared to the previous month. For each of the indicators measured (New Orders, Backlog of Orders, New Export Orders, Imports, Production, Supplier Deliveries, Inventories, Customers’ Inventories, Employment and Prices), this report shows the percentage reporting each response, the net difference between the number of responses in the positive economic direction (higher, better and slower for Supplier Deliveries) and the negative economic direction (lower, worse and faster for Supplier Deliveries), and the diffusion index. Responses are raw data and are never changed. The diffusion index includes the percent of positive responses plus one-half of those responding the same (considered positive).
The resulting single index number for those meeting the criteria for seasonal adjustments (Manufacturing PMI®, New Orders, Production, Employment and Inventories) is then seasonally adjusted to allow for the effects of repetitive intra-year variations resulting primarily from normal differences in weather conditions, various institutional arrangements, and differences attributable to non-moveable holidays. All seasonal adjustment factors are subject annually to relatively minor changes when conditions warrant them. The Manufacturing PMI® is a composite index based on the diffusion indexes of five of the indexes with equal weights: New Orders (seasonally adjusted), Production (seasonally adjusted), Employment (seasonally adjusted), Supplier Deliveries, and Inventories (seasonally adjusted).
Diffusion indexes have the properties of leading indicators and are convenient summary measures showing the prevailing direction of change and the scope of change. A Manufacturing PMI® reading above 50 percent indicates that the manufacturing economy is generally expanding; below 50 percent indicates that it is generally declining. A Manufacturing PMI® above 48.7 percent, over a period of time, indicates that the overall economy, or gross domestic product (GDP), is generally expanding; below 48.7 percent, it is generally declining. The distance from 50 percent or 48.7 percent is indicative of the extent of the expansion or decline. With some of the indicators within this report, ISM® has indicated the departure point between expansion and decline of comparable government series, as determined by regression analysis. The Manufacturing ISM® Report On Business® survey is sent out to Manufacturing Business Survey Committee respondents the first part of each month. Respondents are asked to report on information for the current month for U.S. operations only. ISM® receives survey responses throughout most of any given month, with the majority of respondents generally waiting until late in the month to submit responses to give the most accurate picture of current business activity. ISM® then compiles the report for release on the first business day of the following month.
The industries reporting growth, as indicated in the Manufacturing ISM® Report On Business® monthly report, are listed in the order of most growth to least growth. For the industries reporting contraction or decreases, those are listed in the order of the highest level of contraction/decrease to the least level of contraction/decrease.
Responses to Buying Policy reflect the percent reporting the current month’s lead time, the approximate weighted number of days ahead for which commitments are made for Capital Expenditures; Production Materials; and Maintenance, Repair and Operating (MRO) Supplies, expressed as hand-to-mouth (five days), 30 days, 60 days, 90 days, six months (180 days), a year or more (360 days), and the weighted average number of days. These responses are raw data, never revised, and not seasonally adjusted.
ISM ROB ContentThe Institute for Supply Management® (“ISM”) Report On Business® (both Manufacturing and Non-Manufacturing) (“ISM ROB”) contains information, text, files, images, video, sounds, musical works, works of authorship, applications, and any other materials or content (collectively, “Content”) of ISM (“ISM ROB Content”). ISM ROB Content is protected by copyright, trademark, trade secret, and other laws, and as between you and ISM, ISM owns and retains all rights in the ISM ROB Content. ISM hereby grants you a limited, revocable, nonsublicensable license to access and display on your individual device the ISM ROB Content (excluding any software code) solely for your personal, non-commercial use. The ISM ROB Content shall also contain Content of users and other ISM licensors. Except as provided herein or as explicitly allowed in writing by ISM, you shall not copy, download, stream, capture, reproduce, duplicate, archive, upload, modify, translate, publish, broadcast, transmit, retransmit, distribute, perform, display, sell, or otherwise use any ISM ROB Content.
Except as explicitly and expressly permitted by ISM, you are strictly prohibited from creating works or materials (including but not limited to tables, charts, data streams, time-series variables, fonts, icons, link buttons, wallpaper, desktop themes, online postcards, montages, mashups and similar videos, greeting cards, and unlicensed merchandise) that derive from or are based on the ISM ROB Content. This prohibition applies regardless of whether the derivative works or materials are sold, bartered, or given away. You shall not either directly or through the use of any device, software, internet site, web-based service, or other means remove, alter, bypass, avoid, interfere with, or circumvent any copyright, trademark, or other proprietary notices marked on the Content or any digital rights management mechanism, device, or other content protection or access control measure associated with the Content including geo-filtering mechanisms. Without prior written authorization from ISM, you shall not build a business utilizing the Content, whether or not for profit.
You shall not create, recreate, distribute, incorporate in other work, or advertise an index of any portion of the Content unless you receive prior written authorization from ISM. Requests for permission to reproduce or distribute ISM ROB Content can be made by contacting in writing at: ISM Research, Institute for Supply Management, 309 West Elliot Road, Suite 113, Tempe, Arizona 85284-1556, or by emailing kcahill@ismworld.org. Subject: Content Request.
ISM shall not have any liability, duty, or obligation for or relating to the ISM ROB Content or other information contained herein, any errors, inaccuracies, omissions or delays in providing any ISM ROB Content, or for any actions taken in reliance thereon. In no event shall ISM be liable for any special, incidental, or consequential damages, arising out of the use of the ISM ROB. Report On Business®, PMI®, and NMI® are registered trademarks of Institute for Supply Management®. Institute for Supply Management® and ISM® are registered trademarks of Institute for Supply Management, Inc.
About Institute for Supply Management®Institute for Supply Management® (ISM®) serves supply management professionals in more than 90 countries. Its 50,000 members around the world manage about US$1 trillion in corporate and government supply chain procurement annually. Founded in 1915 as the first supply management institute in the world, ISM is committed to advancing the practice of supply management to drive value and competitive advantage for its members, contributing to a prosperous and sustainable world. ISM leads the profession through the ISM® Report On Business®, its highly regarded certification programs and the ISM® Advance™ Digital Platform. This report has been issued by the association since 1931, except for a four-year interruption during World War II.
The full text version of the Manufacturing ISM® Report On Business® is posted on ISM®‘s website at www.ismrob.org on the first business day* of every month after 10:00 a.m. ET.
The next Manufacturing ISM® Report On Business® featuring January 2023 data will be released at 10:00 a.m. ET on Wednesday, February 1, 2023.
*Unless the New York Stock Exchange is closed.
Contact: | Kristina Cahill |
| | Report On Business® Analyst |
| | ISM®, ROB/Research Manager |
| | Tempe, Arizona |
| | +1 480.455.5910 |
| | Email: kcahill@ismworld.org |
SOURCE Institute for Supply Management
RELATED CONTENT:
UnleashWD People and Talent Survey
Fastenal’s Foundation: Revisiting Bob Kierlin’s Leadership Rules
Fastener News, Manufacturing






 The original tagline, “For the Most Experienced Answers to Puzzling Screw Problems, Call Setko!” began the tradition of the puzzles. Started in the 1950s, the original owner created the puzzles to give to his family, friends, customers, and suppliers for Christmas. The puzzles quickly became a holiday favorite! Soon, everyone wanted these nostalgic puzzles for their family and friends to play. Once the games became popular Marshall Field’s began selling them in their stores nationwide. A display was created front and center at Christmas time showing that year’s sought-after puzzle.



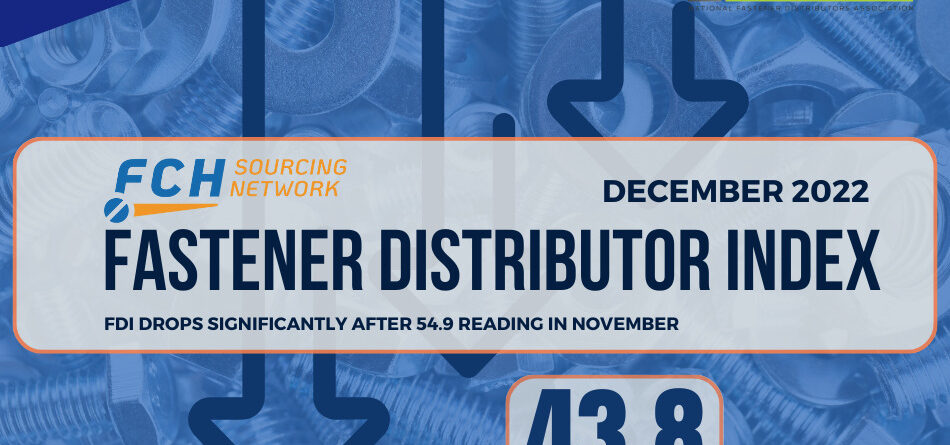


 FND encourages all North American fastener distributors to take part in the FDI. If you are interested in being a more active part of the fastener industry, you can apply to add your company to the FDI survey group. Complete the “Request an Invitation to Participate” form by










 The 10 Basic Rules About Leadership