Author - fluentdesigns

distributor-bay-supply-settles-in-for-the-long-haul-journey-to-marketplace-success

Distributor Bay Supply Settles in for the Long-Haul Journey to Marketplace Success

Mark Brohan | 

The road to success in B2B marketplace development can be long one and the journey along the way maybe full of twists and turns and even dead ends. Bay Supply Co. is a prime example of a company dealing with – and overcoming – the challenges of building a lasting B2B marketplace.

B2B marketplace development movement is accelerating, with all makes and models of companies building platforms and ecommerce strategies they hope will stick with digital business buyers and sellers.

But the road to success can be a long one. And the journey along the way may be full of twists and turns, and even dead ends.

A prime example of a company dealing with — and overcoming – the challenges of building a lasting B2B marketplace is Bay Supply Co.

Bay Supply Blog - Rivets, Fasteners, and Tools

Bay Supply makes a strong entrance to the B2B marketplace world.

Bay Supply, an industrial distributor based in Farmingdale, New York, has been selling a wide array of fasteners to big and small companies since 1961. In December, it rolled out a new marketplace on BaySupply.com. It brings together buyers and sellers in what the company calls a disparate industry.

In less than a year of operation, Bay Supply’s B2B marketplace has attracted about 50,000 buyers to its inventory of nearly 180,000 fastener products. Its products range from rivets, lock bolts and blind bolts to blind sealing plugs, rivet nuts, helical inserts, and key locking inserts.

“We are onboarding about one or two sellers each week,” says Bay Supply chief operating officer Michael Eichinger.

But even though its marketplace is on track to generate significant first-year gross merchandise volume, Eichinger doesn’t see Bay Supply’s marketplace as truly successful — yet.

“In ecommerce, three years is about the average time so achieve a true return on investment on a major initiative,” he says. “With a marketplace it might be five years to eight years.”

Development period

Bay Supply spent two years developing the platform. The marketplace was designed and launched in conjunction with McFadyen Digital, an ecommerce and marketplace consulting firm. It was a new extension of Bay Supply’s Magento ecommerce platform.

But building the platform wasn’t the most difficult challenge, Eichinger says. One big challenge is educating industry buyers and sellers on the premise that the marketplace is a new, fast and easier digital channel to help find and purchase products.

“A marketplace isn’t about just bringing buyers and sellers together,” Eichinger says. “The value-add is making someone’s job easier.”

Ongoing transition to digital

Fastener-industry manufacturers have varying degrees of ecommerce expertise and technology. So, the time and resources needed to connect sellers to the Bay Supply marketplace varies widely.

“Every day is a new challenge,” Eichinger says. “In this industry, there is a lag in technology. Some companies with 1,000 products, we can onboard in a day or two. But for others with 16,000 products, it may take a week or more.”

To attract digital buyers and sellers, Bay Supply is offering free registration to distributors that sell fastening products. It plans to offer digital buyers more than 2,000 types of rivets, bolts, threaded inserts and related tools.

Bay Supply will also work with distributors to add new categories to better position their product offerings, the distributor says. Digital tools available on the marketplace include automated workflows and dashboards that multiple users can access.

B2B marketplaces that serve specific markets and industries will proliferate, Eichinger says. In the long term, what will make any marketplace successful is how well it connects and serves its core market. “In the end, there has to be the network effect,” he says.

CONTENT SOURCE: Digital Commerce 360


USE FND DISCOUNT CODE: FND50 FOR 50% off Registration FOR #IFE2022 >>


RELATED CONTENT:

Bay Supply Launches New B2B Vertical Marketplace for Fastening Industry

Top 5 Things-To-Do to Get Ready for IFE 2022

Featured, Technology

Read more...
fastenal-company-reports-2q22-earnings

Fastenal Company Reports 2Q22 Earnings

Fastenal

WINONA, Minn., July 13, 2022 (BUSINESS WIRE) — Fastenal Company (Nasdaq: FAST), a leader in the wholesale distribution of industrial and construction supplies, today announced its financial results for the quarter ended June 30, 2022. Except for share and per share information, or as otherwise noted below, dollar amounts are stated in millions. Throughout this document, percentage and dollar calculations, which are based on non-rounded dollar values, may not be able to be recalculated using the dollar values included in this document due to the rounding of those dollar values.

From a product standpoint, we have three categories: fasteners, safety products, and other products, the latter of which includes eight smaller product categories, such as tools, janitorial supplies, and cutting tools. Fastener daily sales increased 21.2% over the second quarter of 2021, and represented 34.6% of our net sales in the second quarter of 2022; fasteners represented 33.6% of net sales in the second quarter of 2021. Safety product daily sales increased 13.8% over the second quarter of 2021 and represented 20.3% of our net sales in the second quarter of 2022; safety products represented 21.0% of net sales in the second quarter of 2021. Other products daily sales increased 17.0% over the second quarter of 2021 and represented 45.1% of our net sales in the second quarter of 2022; other products represented 45.4% of net sales in the second quarter of 2021.

Q2 2022 Investor Presentation

Q2-2022-Investor-Presentation-7.12-R7_No-Footers_FINAL

Full Press Release:

EX_99.1-06.30.2022-Earnings-Release-7.12-R8_No-Footers_FINAL


RELATED CONTENT:

Fastenal Named University’s Employer of the Year

Fastenal Company Reaches eCommerce Milestone

Fastener News, Fasteners

Read more...
fastenal-named-university’s-employer-of-the-year

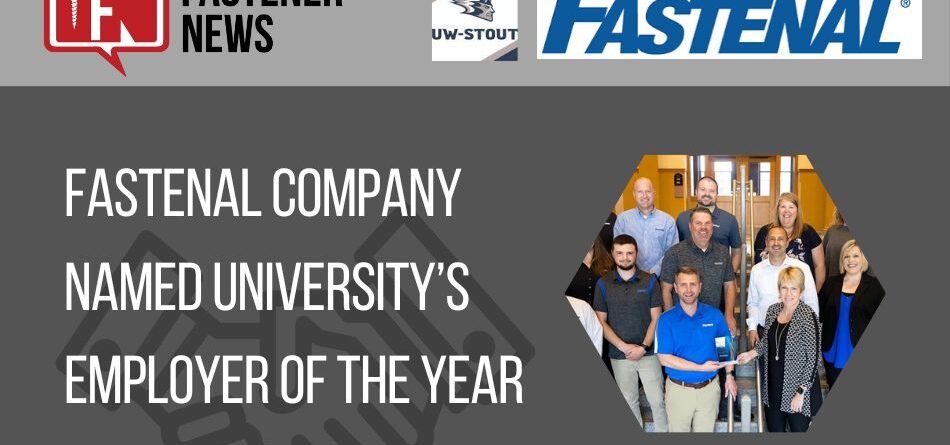
Fastenal Named University’s Employer of the Year

Graduates hired in recent years are from a variety of majors, including engineering, applied mathematics and computer science, interior design, supply chain management, business administration, and professional communication and emerging media.

Ramirez, of Chippewa Falls, has a master’s degree in school counseling from UW-Stout and previously worked as a school counselor at Menomonie High School. His duties included helping high school students with career planning.

Now, he’s helping students take the next step, starting their careers, and building on a company-university relationship that goes back more than 25 years.

“We know Stout has great students,” Ramirez said, citing the university’s in-demand students with a 98.4% employment rate for recent graduates. “We’re looking for great people who fit our company and our culture.”

Fastenal is a Fortune 500 company. It also is ranked No. 148 on Forbes’ list of best employers and No. 472 in Forbes’ ranking of top public companies.

Ramirez attended the award presentation at UW-Stout with six other Fastenal representatives, including Mike Rausch, director of recruiting; Tony Eger, district manager; Justin Oleson, Menomonie Fastenal general manager; Chris Rivard, engineering manager; Shannon Hintz, Lean Solutions manager; and Bruce Brinkmann, regional sales specialist.

The campus visit included touring engineering labs in Jarvis and Fryklund halls, discussing the business administration program with Professor Mark Fenton and meeting with Chancellor Katherine Frank.

Rausch said Fastenal is “looking for future leaders” when it hires college graduates, with the opportunity to grow into their careers or switch careers within the company. The company has a promote-from-within philosophy, he said.

Along with Barts, Frank and Fenton, UW-Stout officials taking part were Provost Glendalí Rodriguez; assistant professors of engineering Vince Wheeler and Anne Schmitz; instrument instructor Paul Craig; and Michelle Dingwall, senior development officer for Stout University Foundation.

Career Services began the Employer of the Year award in 2021. The first recipient was Menards.

“These are companies that set the bar high, that set the standard,” Barts said of the award winners.

Student success is the leading goal of UW-Stout’s FOCUS2030 strategic plan.  

In 2021, CollegeValuesOnline ranked UW-Stout No. 26 in the U.S. for its ties to business and industry and how those ties benefit students.

###

Content Source: UW-Stout


RELATED CONTENT:

Fastenal Company Reaches eCommerce Milestone

Fastenal Converts Branches in Continued Shift to Digital

Read more...
in-the-news-with-fastener-news-desk-the-week-of-july-11th,-2022

IN THE NEWS with Fastener News Desk the Week of July 11th, 2022

I’m Lisa Kleinhandler, Editor-in-Chief at Fastener News Desk

It’s IN THE NEWS the Week of July 11th, 2022

Economic activity in the manufacturing sector grew in June, with the overall economy achieving a 25th consecutive month of growth, say the nation’s supply executives in the latest Manufacturing ISM® Report On Business®.

“The June Manufacturing PMI® registered 53 percent, down 3.1 percentage points from the reading of 56.1 percent in May. This figure indicates expansion in the overall economy for the 25th month in a row after a contraction in April and May 2020. This is the lowest Manufacturing PMI® reading since June 2020, when it registered 52.4 percent. The New Orders Index reading of 49.2 percent is 5.9 percentage points lower than the 55.1 percent recorded in May.

Read full release: 


In Fastener Industry News…

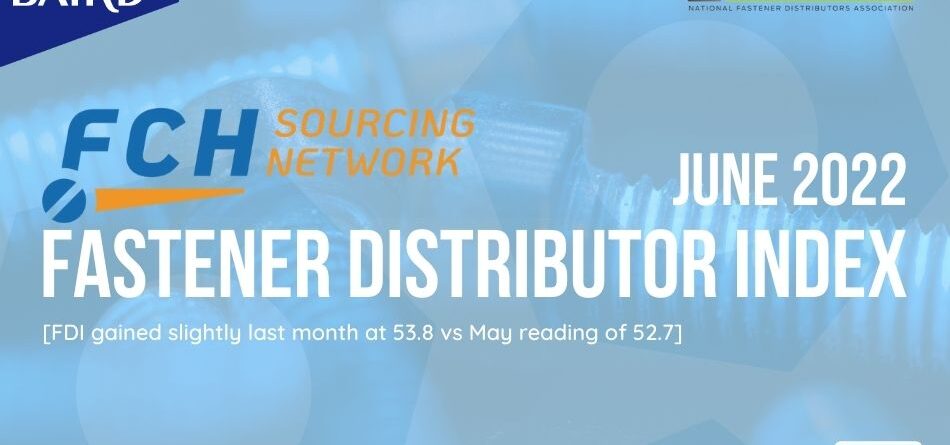
The June seasonally adjusted Fastener Distributor Index (FDI) reading was 53.8, improved vs. last month, indicating slightly faster growth than May. The pricing indices moderated some as respondents noted softening commodity prices and some improvement in material shortages/lead times. Customer demand seemingly remains strong, although a few participants noted some softening ahead was expected. Accordingly, the Forward-Looking Indicator (FLI) fell to just mildly above expansionary levels at 51.5 as respondents offered mixed outlooks: some see no signs of slowdown, others predict softening customer demand in coming months. Net, we believe growth and overall market conditions in June remained solid but see potential signs of decelerating growth in the second half of the year.

Read full release: 


REGISTRATION IS NOW OPEN for the 41st edition of the International Fastener Expo which will take place in Las Vegas, NV October 17-19th. The IFE is Largest B2B expo of Industrial Fasteners and Tooling & Machinery in North America. Since 1981, the event continues to bring together the manufacturers and master distributors of fasteners and other related products and services with distributors and sales agents in the entire supply and distribution chain.

IFE Exhibitors! With more than 300 companies already registered, space is running out to exhibit at this year’s expo. Don’t miss your opportunity to make an impact at the largest B2B expo for #fasteners, tooling & machinery!

This year’s expo is going to be bigger and better than ever and FND will be looking forward to awarding the next Best Booth winners! The overall BEST BOOTH will be awarded a first ever Ultimate Championship Customized Belt. You’re going to want to WIN the belt and bragging rights for years!

Go to https://fastenershows.com to book your space

GET REGISTERED today! USE FND’s Discount Code: FND50 and SAVE 50% off registration.


In Fastener Event News …

The Fastener Training Institute has a NEW webinar: Testing Fasteners which will be happening on Tuesday, July 26 11 a.m. to 1 p.m. CST. The two-hour technical webinar will explore the assortment of test choices for fasteners. Participants will learn about some of the key tests, hardness, tensile strength, shear strength and corrosion, that every fastener manufacturer or supplier should be familiar with. Get more info and register at FastenerTraining.org


Image

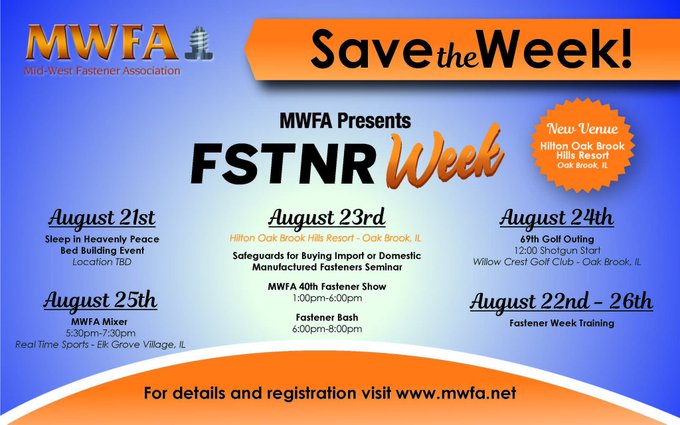
Save the dates: August 21-26th for the Midwest Fastener Association’s FSTNR WEEK! Get involved in a Charity Bed Building Event that benefits the Sleep in Heavenly Peace Organization, plus A Fastener seminar, golf outing and lots more! 👉 Registration and more info: http://MWFA.net


The Fastener Training Institute

The Fastener Training Institute’s Fastener Training Week in-person training class is scheduled for August 22-26 in Chicago. The advanced technical training program is offered in partnership with Industrial Fastener Institute and is for fastener distributors, manufacturers, and end-users.

Fastener Training Week, hosted by the Mid-West Fastener Association, offers five intensive days of education and plant tours as part of the FTI Certified Fastener Specialist™ (CFS) advanced technical training program. Attendees will be eligible for the Certified Fastener Specialist™ (CFS) designation.

For more info go to: https://www.fastenertraining.org/


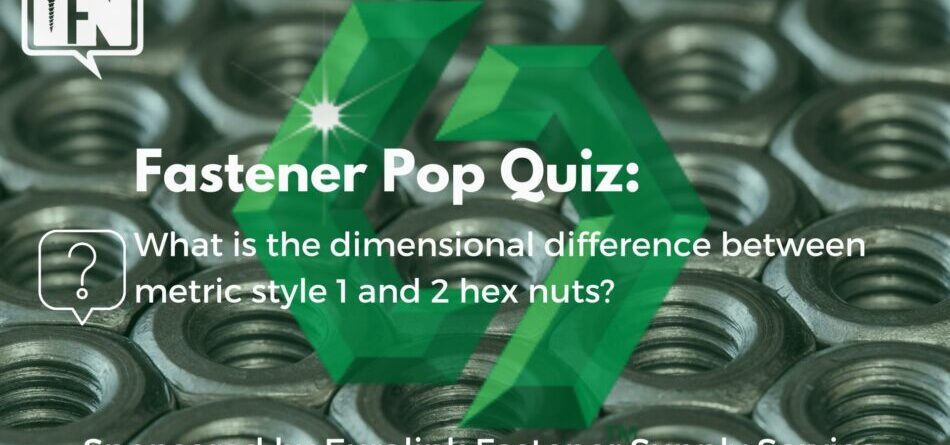
Test your knowledge of METRIC #fasteners with this week’s FASTENER POP QUIZ! 🔩

Sponsored by Eurolink Fastener Supply Service “Hard-to-Find Metric Fasteners Delivered” Go to: EurolinkFSS.com


🏆 for the past 40 years the International Fastener Expo Fastener Hall of Fame has recognized professionals who have made significant and enduring contributions to the fastener industry. Who do you think should be honored with this prestigious award this year? To nominate go to FastenerShows.com. The deadline to submit nominations is July 30th.


The stories featured in this week’s episode of IN THE NEWS can be found at Fastener News Desk or in our Twitter feed @FastenerNews and on LinkedIn in the Fastener News Group!


Product Genius Technology Enhance your website customer experience with the best view for industrial product search. The past two years have certainly been a digital wake-up call for distributors and manufacturers. B2B buyers’ behaviors have gone full on digital! Digitizing data and product information is key to the beginnings of your business’s digital transformation.  Is your product data ready for eCommerce and a great user experience.

Product Genius Technology’s services include, data cleaning and preparation, consulting, and strategizing. Contact ProductGeniusTechnology.com or call 1-800-fasteners to find out how to get started today.


If you would like to share your company’s events, news or sponsor an upcoming episode of IN THE NEWS or would like to add to the Fastener Museum me: lisa@fastenernewsdesk.com.


Thanks for tuning in to this week’s episode of IN THE NEWS with Fastener News Desk.

Until next week, be well, be safe and Keep it Fastenating.


RELATED CONTENT:

IN THE NEWS with Fastener News Desk the Week of July 4th, 2022

IN THE NEWS with Fastener News Desk the Week of June 27th, 2022

Fastener News, Fastener TV, Featured

Read more...
fastener-pop-quiz:-metric-fasteners

Fastener Pop Quiz: METRIC FASTENERS

EUROLINK FASTENER SUPPLY & SERVICE “Hard-to-Find Metric Fasteners Delivered”

Eurolink is the premier US Distributor of metric fasteners and fastener lines with hard-to-find metric fasteners manufactured to both DIN and ISO standards. As the nation’s leading source for hard-to-find metric fasteners, Eurolink offers access to more than 100,000 quality C-class parts from countries such as Germany, Italy, Switzerland, Poland, Spain, France, and Great Britain. Regardless of your required size, material, or finish, Eurolink has the European resources to meet your demands. If you’re looking for a top fastener supplier you’ve found one!

Read more...
fastener-distributor-index-(fdi)-|-june-2022

Fastener Distributor Index (FDI) | June 2022

Fastener Distributor Index (FDI) survey for June, 2022

The FDI gained slightly last month at 53.8 versus the May reading of 52.7, seasonally adjusted. In contrast, the Forward Looking Indicator (FLI) showed showed signs of sagging optimism and dipped to 51.5 versus 55.4 in May.  Still remaining in growth territory, the reading marks the 25th consecutive month of positive (+50.0) outlook.

Key Takeaway:

The June seasonally adjusted Fastener Distributor Index (FDI) reading is 53.8, improved vs. last month, indicating slightly faster growth than May. The pricing indices moderated some (albeit remaining at elevated levels) as respondents noted softening commodity prices and some improvement in material shortages/lead times. Customer demand seemingly remains solid/strong, although a few participants noted some softening ahead was expected. Accordingly, the Forward-Looking Indicator (FLI) fell to just mildly above expansionary levels at 51.5 as respondents offered mixed outlooks (some see no signs of slowdown, others predict softening customer demand in coming months). Net, we believe growth and overall market conditions in June remained solid but see potential signs of decelerating growth in the second half of the year

FDI_Report_June_2022


We encourage all North American fastener distributors to take part in the FDI. If you are interested in being a more active part of the fastener industry, you can apply to add your company to the FDI survey group. Complete the “Request an Invitation to Participate” form by clicking here. Once verified, you will receive login ID and password information and you will be notified by email every month when the survey period has been opened. – Fastener News Desk


About the Fastener Distributor Index (FDI).

The Fastener Distributor Index (FDI) was developed as a service to the fastener industry by the FCH Sourcing Network in 2012 to be a new benchmark for the fastener industry.

The FDI is a monthly survey of North American fastener distributors, conducted with the FCH Sourcing Network and Baird with support from the National Fastener Distributors Association. It offers insights into current fastener industry trends/outlooks. Similarly, the Forward-Looking Indicator (FLI) is based on a weighted average of four forward-looking inputs from the FDI survey. This indicator is designed to provide directional perspective on future expectations for fastener market conditions. As diffusion indexes, values above 50.0 signal strength, while readings below 50.0 signal weakness. Over time, results should be directly relevant to Fastenal (FAST) and broadly relevant to other industrial distributors such as W.W. Grainger (GWW) and MSC Industrial (MSM).

The FDI Survey website is a resource than can be accessed by anyone, but it can only be updated by registered users during the monthly open survey period, which occurs during the last week of each month.

Listen to episode #178 of the Fully Threaded Radio podcast for further commentary and analysis on the Fully Threaded Radio podcast at FullyThreaded.com.

Contact:

Eric Dudas | O: 877.332.7836 | C: 630.532.2442

www.fastenersclearinghouse.com


RELATED CONTENT: 

FASTENER DISTRIBUTOR INDEX (FDI) | MAY 2022

FASTENER DISTRIBUTOR INDEX (FDI) | April 2022

Fastener Distributor Index

Read more...
in-the-news-with-fastener-news-desk-the-week-of-july-4th,-2022

IN THE NEWS with Fastener News Desk the Week of July 4th, 2022

It’s IN THE NEWS the Week of July 4th, 2022 

America celebrated her 246th birthday yesterday with celebrations across our nation. Its going to be a short week so let’s get right to in the news:

WATCH ‘IN THE NEWS’ NOW (6:23)

Bloomberg: Senior US and Chinese officials discussed US economic sanctions and tariffs today amid reports the Biden administration is close to rolling back some of the trade levies imposed by the former President.

The lifting of tariffs and sanctions and the fair treatment of Chinese enterprises are areas of concern to China their Vice Premier told US Treasury Secretary Janet Yellen in a video call Tuesday morning.

According to China, the two sides discussed economic policy and stabilizing global supply chains, agreeing that it’s significant for the US and China to strengthen communication and coordination in those areas for the benefit of both countries and the rest of the world. The talks were pragmatic and constructive, according to the statement.

Reuters: reported last week that China’s commerce ministry said it would extend anti-dumping tariffs on certain steel fasteners imported from the European Union and United Kingdom for five years.

The anti-dumping tariffs were imposed on June 29, the ministry said in a statement.


In Fastener Business Acquisition News…

AFC Industries has acquired U.K. based TFC Ltd. (https://tfc.eu.com/) Terms of the deal were not disclosed. For over 60 years, TFC has been one of Europe’s leading suppliers of industrial fastening products and services supplying customers via a network of UK and European locations. TFC offers customized VMI, product solutions, and engineering & design consultation for a wide range of industrial markets.

AFC CEO Kevin Godin said, “we have been looking for some time to be able to better support customers

in Europe, but it was crucial to find the right team who shared AFC values and bias for execution. We

recognized in TFC a similar commitment to customer service, team culture, and execution that have

been central to AFC’s success. We are excited to have Morgan and his team join the AFC family and

supporting them in their continued growth.”


REGISTRATION IS NOW OPEN for the 41st edition of the International Fastener Expo which will take place in Las Vegas, NV October 17-19th. The IFE is Largest B2B expo of Industrial Fasteners and Tooling & Machinery in North America. Since 1981, the event continues to bring together the manufacturers and master distributors of fasteners and other related products and services with distributors and sales agents in the entire supply and distribution chain.

IFE Exhibitors! With more than 300 companies already registered, space is running out to exhibit at this year’s expo. Don’t miss your opportunity to make an impact at the largest B2B expo for #fasteners, tooling & machinery!

This year is going to be bigger and better than ever! FND is looking forward to awarding the Best Booth winners. This year the overall Best Booth Award winner will walk away with a customized Ultimate 6lb Championship Belt.

IFE Exhibitors you’re going to want to WIN the championship Best Booth Award belt!

Go to https://fastenershows.com to book your space + GET REGISTERED today!


In Fastener News…

The Gilchrist Foundation has awarded four scholarships from the 2022 applicants.  Congratulations to the recipients. Find out which candidates and companies were chosen featured at Fastener News Desk.

Kyndal Shannon-Hercules Bolt

Issayana Camacho-Kanebridge Corp

Myles Prodoehl-Valley Fastener Group

Maxton Blackburn-Hanger Bolt & Stud


In Fastener Event News …

Image

Save the dates: August 21-26th for the Midwest Fastener Association’s FSTNR WEEK! Get involved in a Charity Bed Building Event that benefits the Sleep in Heavenly Peace Organization, plus A Fastener seminar, golf outing and lots more! 👉 Registration and more info: http://MWFA.net

Twitter: @MWFA_News @ShpBeds


The Fastener Training Institute

The Fastener Training Institute

The Fastener Training Institute’s Fastener Training Week in-person training class is scheduled for August 22-26 in Chicago. The advanced technical training program is offered in partnership with Industrial Fastener Institute and is for fastener distributors, manufacturers, and end-users.

Fastener Training Week, hosted by the Mid-West Fastener Association, offers five intensive days of education and plant tours as part of the FTI Certified Fastener Specialist™ (CFS) advanced technical training program. Attendees will be eligible for the Certified Fastener Specialist™ (CFS) designation. Register for Fastener Training Week before July 8 and get FTI’s Fastener Basics 3-part Webinar Series for FREE!


🏆 The International Fastener Expo Fastener Hall of Fame recognizes professionals who have made significant and enduring contributions to the fastener industry. This year marks the 40th anniversary of the IFE Hall of Fame Awards! Who do you think should be honored with this prestigious award this year? To nominate go to FastenerShows.com. The deadline to submit nominations is July 30th. Twitter: @FastenerShow


The stories featured in this week’s episode of IN THE NEWS can be found at Fastener News Desk or in our Twitter feed @FastenerNews and on LinkedIn in the Fastener News Group!


Product Genius Technology. Enhance your website customer experience with the best view for industrial product search. The past two years have certainly been a digital wake-up call for distributors and manufacturers. B2B buyers’ behaviors have gone full on digital! Digitizing data and product information is key to the beginnings of your business’s digital transformation.  Is your product data ready for eCommerce and a great user experience.

Product Genius Technology’s services include, data cleaning and preparation, consulting, and strategizing. Contact ProductGeniusTechnology.com or call 1-800-fasteners to find out how to get started today.


If you would like to share your company’s events, news or sponsor an upcoming episode of IN THE NEWS or would like to add to the Fastener Museum me: lisa@fastenernewsdesk.com.


Thanks for tuning in to this week’s episode of IN THE NEWS with Fastener News Desk.

Until next week, be well, be safe and Keep it Fastenating.


RELATED CONTENT:

IN THE NEWS with Fastener News Desk the Week of June 27th, 2022

Fastener TV

Read more...
extreme-innovation-with-ai:-stanley-black-&-decker’s-mark-maybury

Extreme Innovation With AI: Stanley Black & Decker’s Mark Maybury

Me, Myself, and AI

Me, Myself & AI | A Podcast on Artificial Intelligence in Business

Why do only 10% of companies succeed with AI? We’re on a mission to figure it out. On Me, Myself, and AI, you’ll meet the people who are achieving big wins with AI. This season we’re talking to leaders from Stanley Black & Decker, LinkedIn, eBay, and more about their experiences with human/machine collaboration.

Listen to episode. 

Stanley Black & Decker is best known as the manufacturer of tools for home improvement projects, but it also makes products the average consumer seldom notices, like fasteners to keep car parts secure and the electronic doors typically used at retail stores. Me, Myself, and AI podcast hosts Sam Ransbotham and Shervin Khodabandeh sat down with Mark Maybury, the company’s first chief technology officer, to learn how artificial intelligence factors into this 179-year-old brand’s story.

Transcript

Sam Ransbotham: AI applications involve many different levels of risk. Learn how Stanley Black & Decker considers its AI risk portfolio across its business when we talk with the company’s first chief technology officer, Mark Maybury.

Welcome to Me, Myself, and AI, a podcast on artificial intelligence in business. Each episode, we introduce you to someone innovating with AI. I’m Sam Ransbotham, professor of information systems at Boston College. I’m also the guest editor for the AI and Business Strategy Big Ideas program at MIT Sloan Management Review.

Shervin Khodabandeh: And I’m Shervin Khodabandeh, senior partner with BCG, and I colead BCG’s AI practice in North America. Together, MIT SMR and BCG have been researching AI for five years, interviewing hundreds of practitioners and surveying thousands of companies on what it takes to build and to deploy and scale AI capabilities across the organization and really transform the way organizations operate.

Sam Ransbotham: Today we’re talking with Mark Maybury, Stanley Black & Decker’s first chief technology officer. Mark, thanks for joining us. Welcome.

Mark Maybury: Thank you very much for having me, Sam.

Sam Ransbotham: Why don’t we start with your current role. You’re the first chief technology officer at Stanley Black & Decker. What does that mean?

Mark Maybury: Well, back in 2017, I was really delighted to be invited by our chief executive officer, Jim Loree, to really lead the extreme innovation enterprise across Stanley Black & Decker. So I get involved in everything from new ventures to accelerating new companies, to fostering innovation within our businesses and just in general being the champion of extreme innovation across the company.

Sam Ransbotham: You didn’t start off as a CTO of Black & Decker. Tell us a bit about how you ended up there.

Mark Maybury: If you look at my history — you know, “How did you get interested in AI?” — AI started when … literally, I was 13 years old. I vividly remember this; it’s one of those poignant memories: [In] 1977, I saw Star Wars, and I remember walking out of that movie being inspired by the conversational robots — R2-D2, C-3PO — and the artificial intelligence between the human and the machine. And I didn’t know it at the time, but I was fascinated by augmented intelligence and by ambient intelligence. They had these machines that were smart and these robots that were smart. And then that transitioned into a love of actually understanding the human mind.

In college, I studied with a number of neuropsychologists as a Fenwick scholar at Holy Cross, working also with some Boston University faculty, and we built a system to diagnose brain disorders in 1986. It’s a long time ago, but that introduced me into Bayesian reasoning and so on. And then, when I initiated my career, I was trained really globally, so I studied in Venezuela as a high school student; as an undergraduate, I spent eight months in Italy learning Italian; and then I went to England and Cambridge and I learned English.

Sam Ransbotham: The real English.

Mark Maybury: The real English. [Laughs.]

Sam Ransbotham: C-3PO would be proud.

Mark Maybury: C-3PO, exactly! … Indeed, my master’s was in speech and language processing. Sorry, you can’t make this up. I worked with Karen Spark Jones, a professor there who was one of the great godmothers of computational linguistics. But then I transitioned back to becoming an Air Force officer, and right away, I got interested in security: national security, computer security, AI security. I didn’t know it at the time, but we were developing knowledge-based software development, and we’d think about “How do we make sure the software is secure?”

Fast-forward to 20 years later. I was asked to lead a federal laboratory, the National Cybersecurity Federally Funded Laboratory at Mitre, supporting NIST [the National Institute of Standards and Technology]. I had come up the ranks as an AI person applying AI to a whole bunch of domains, including computer security — building insider threat-detection modules, building penetration testing, automated agents, doing a lot of machine learning of malware — working with some really great scientists at Mitre, in the federal government, and beyond, [in] agencies and in commercial companies.

And so that really transformed my mind in terms of how do we … for example, I’ll never forget working together with some scientists on the first ability to secure medicine pumps that are the most frequently used device in a hospital. And so that’s the kind of foundation of security thinking and risk management that comes through. I got to work with the great Donna Dodson at NIST and other great leaders. And so those really were foundational theoretical and practical underpinnings that shaped my thinking in security.

Sam Ransbotham: But doesn’t it drive you crazy, then, that so much the world has this “build it and then secure it later” approach? I feel like that’s pervasive in software in general, but certainly around artificial intelligence applications. It’s always the features first and secure it later. Doesn’t it drive you insane? How can we change that?

Mark Maybury: There are methods and good practices, best practices, for building resilience into systems, and it turns out that resilience can be achieved in a whole variety of ways. For example, we mentioned diversity. That’s just one strategy. Another strategy is loose coupling. The reason pagodas famously last for hundreds and hundreds of years in Japan is because they’re built with structures like, for example, central structures that are really strong, but also hanging structures that loosely couple and that can absorb, for example, energy from the earth when you get earthquakes.

So these design principles, if you think about a loosely coupled cyber or a piece of software system, and even of course decoupling things, right, so that you disaggregate capabilities, so that if a power system or a software system goes down locally, it doesn’t affect everyone globally — some of these principles need to be applied. They’re systems security principles, but they can absolutely be applied in AI. I mean, it’s amazing how effective people can be when they’re in an accident. They’ve got broken bones, they’ve got maybe damaged organs, and yet they’re still alive. They’re still functioning. How does that happen? And so nature’s a good inspiration for us.

We can’t forget, in the end, our company has a purpose for those who make the world. And that means that we have to be empathetic and understanding of the environments in which these technologies are going to go into and make sure that they’re intuitive, they’re transparent, they’re learnable, they’re adaptable to those various environments, so that we serve those makers of the world effectively.

Shervin Khodabandeh: Mark, as you’re describing innovation, I think your brand is very well recognized and a lot of our audience would know [it], but could you just maybe quickly cover — what does Stanley Black & Decker do, and how have some of these innovations maybe changed the company for the better?

Mark Maybury: Well, it’s a great question. One of the delights of coming to this company was learning what it does. So I knew Stanley Black & Decker, like many of your listeners will know, as a company that makes DeWalt tools — hand tools or power tools or storage devices. Those are the things that you’re very familiar with. But it turns out that we also have a several-billion-dollar industrial business. We robotically insert fasteners into cars, and it turns out that 9 out of every 10 cars or light trucks on the road today are held together by Stanley fasteners.

Similarly, I didn’t know beforehand, but in 1930 we invented the electronic door — the sliding door. So next time you walk into a Home Goods or Home Depot or a Lowe’s, or even a hospital or a bank, if you look up and you look to the left, you’ll notice — there’s a 1-in-2 chance there’ll be a Stanley logo, because we manufacture one of every two electronic doors in North America.

And there are other examples, but those are innovations, whether it be protecting 2 million babies with real-time location services in our health care business or producing eco-friendly rivets that lightweight electric vehicles [use]. These are some examples of the kind of innovations that we’re continuously developing. Because basically, every second, 10 Stanley tools are sold around the world — every second. And so whether it’s Black & Decker, whether it’s DeWalt, whether it’s Craftsman, these are household brands that we have the privilege to influence the inventive future of.

Shervin Khodabandeh: You’re really everywhere. And every time I sit in my car now, I’m going to remember that, like the strong force that keeps the nucleus together, you are keeping my car together. That’s fantastic. Can you give us an example of extreme innovation versus nonextreme?

Mark Maybury: Sure. By extreme, we really mean innovation of everything, innovation everywhere, innovation by everyone. We actually, interestingly, within the company delineate between six different levels of innovation. We’re just in the past six months becoming much more disciplined across the entire corporation, with a common rubric for how we characterize things. So it’s a great question. Levels one and two, those are incremental improvements, let’s say to product or a service. Once we get to level three, we’re talking about something where we’re beginning to make some significant change to a product. When we get to level four, we’re talking about maybe three major or more new features. It’s something that, really, you’re going to significantly notice. When we talk about a level five, this is first of a kind, at least for us. It’s something that we may have never experienced in our marketplace. Those we oftentimes call breakthrough innovations.

And finally, on level six, which are radical innovations, those are things that are world firsts. And to give you a concrete example, we just introduced to the marketplace the first utilization of pouch battery technologies, a successor to the Flexvolt batteries, which are essentially an ability, using pouch technology, to double the power — a 50% increase in power in batteries for tools, two times the life cycle, reductions in the weight and the size of those. So that’s an example of an extreme innovation that’s going to revolutionize power tools. That’s called Powerstack.

Another example we brought forward in Black & Decker [is] Pria. Pria is the first conversational home health care companion. It’s an example of using speech and language and conversational technology to support medicine distribution to those who want to age in place, for example, in the home, but also using AI to detect anomalies and alert caretakers to individuals. So those are examples that can be really transformative.

Shervin Khodabandeh: Levels one through six implies there is a portfolio and that there is an intention about how to build and manage and evolve that portfolio. Can you comment a bit [on] how you think about that and how much, like in level one versus level six, and what are some of the trade-offs that you consider?

Mark Maybury: That’s an excellent question. Basically, it is really market-driven, and it’s even going to be further product and segment-driven. If you’re selling a software service, you’re going to want to have that modified almost [in] real time. But certainly within months, you’re going to want to be evolving that service so that incremental modification might occur. We have an ability to just upload a new version of our cyber-physical end effector, if you will — whatever it happens to be.

But to answer your question, oftentimes companies will, over time, if they don’t pay attention to their level one through six — so from incremental all the way up to radical — they’ll end up with a portfolio that drifts to the incrementalism, that’s only focused on minor modifications. Those are easy to do. You get an immediate benefit in the marketplace, but you don’t get a long-term, a medium- or long-term, shift. And so what we intentionally do is measure in empirical fashion, how much growth and how much margin and how much consumer satisfaction am I getting out of those level ones all the way up to level sixes? Because any organization is going to naturally be resource constrained in terms of money, in terms of time, in terms of talent. What you need to do is you need to ideally optimize. And if the marketplace is rewarding you for, let’s say, having new products and services in class four, which have major improvements, but they penalize you for having radical improvements because they just can’t … it’s this cognitive dissonance: “What do you mean home health companion? I don’t know what that is. I just want a better tongue depressor.”

And so in that case, you really need to appreciate what the marketplace is willing to adopt, and we have to think about, if you do have a radical innovation, how are you going to get into the channel? And one final thing I’ll say, because your question’s an excellent one about portfolio, is, we actually go one step further, which is not only do we look at what the distribution of the classes are and what the response to those investments are over time, but we further, for any particular individual investment, we actually put it into a portfolio that characterizes the technical risk and the business risk. We actually use technical readiness levels, which come out of NASA and the Air Force — my previous life — and are used now in the business community, and then we invent it.

Actually, previously, when I was working for the federal government, we created commercial readiness levels, and I’ve imported those into Stanley Black & Decker. And now we actually have a portfolio for every single business and the company as a whole, for the first time ever. And that’s something that we’re really delighted to finally bring to the company — an ability to look at our investments as a portfolio — because only then can we see, are we trying to achieve “unobtainium,” because it’s technically unachievable, or, equally bad, is there no market for this? You may invent something that’s really great, and if the customer doesn’t care for it, it’s not going to be commercially viable. And so those are important dimensions to look at in portfolio analysis.

Shervin Khodabandeh: I’m really happy that you covered risk, because that was going to be my follow-on question. Even that must be a spectrum of risk and a decision: How much risk is the right level of risk, and how much do you wait to know whether the market’s really liking something or not? I’m not going to put words in your mouth, but I was just going to infer from that, that you were saying that’s a lever and a decision that you guys manage based on how the economics of the market and the company are, and when you want to be more risky versus less risky.

Mark Maybury: Absolutely. And there are many voices that get an opportunity to influence the market dynamics. If you think of the Five Forces model of Porter, classically you’ve got your competitors, your suppliers, your customers, and yourself, and all of these competitive forces are active. And so one of the things we try to do is measure, is listen. Our leadership model within our operating model at the company is listen, learn, and lead. That listening and learning part is really, really critical; if you’re not listening to the right signals — if you don’t have a customer signal, you don’t have a technological disruption signal, if you don’t have an economic signal, a manufacturing and supply signal, you need all those signals. And then, importantly, you need lessons learned; you need good practices.

Early in the idea generation side, are you using design thinking? Are you using diverse teams? Are you gathering insights in an effective way? And then, as you go through to generating opportunities, are you beginning to do competitive analysis, like I just talked about? As you begin to look into these specific business cases, are you trying things out with concept cars or proof of concepts and then getting to … “Maybe we don’t have the solution. Maybe we ought to have some open innovation outside the company.”

And then, ultimately, in our commercial execution, do they have the right sales teams, the right channels, the right partnerships to go to scale? And so the challenge is, we can oftentimes — whether it be manufacturing or products — we can get into pilot purgatory. We can create something that looks really, really exciting and promising to the marketplace, but it’s unmanufacturable, or it’s unsustainable, or it’s uninteresting or uneconomical. And that’s really not good. You really have to have a holistic intent in mind throughout the process, and then, importantly, a discipline to test and to measure and to fail fast and eventually be ready to scale quickly when something does actually hit, if you will, the sweet spot in the market.

Sam Ransbotham: So there’s lots of different things in these levels. Can you tie them to artificial intelligence? Like, is artificial intelligence more risky in market risk? Is it more risky in technical risk? How is that affecting each of your different levels, and what’s the intersection of that matrix with artificial intelligence?

Mark Maybury: Great question. Our AI really applies across the entire company. We have robotic process automation [RPA], which is off the shelf, low risk, provable, and we automate IT elements in finance, elements in HR. We have actually almost 160 digital employees today that just do automated processes, and it makes our own … we call it not only AI, but sometimes augmented intelligence, not artificial intelligence. How do we augment the human to get them more effective? So to your question, what’s risky —

Sam Ransbotham: That seems [like] less risk.

Mark Maybury: That’s very low risk. RPAs are very, very low risk. However, if I’m going to introduce Pria into the marketplace, or Insight, which is a capability in our Stanley industrial business for IoT measurement, for predictive analytics, for shears indoor extensions, to very large-scale excavation equipment, and so on — in that case, there could be a very high risk, because there might be user adoption risk, there’s sensor relevance risk, there’s making sure your predictions are going to work well. There could be a safety risk as well as an economic risk. So you want to be really, really careful to make sure that those technologies in those higher-risk areas will work really, really well, because they might be life critical if you’re giving advice to a patient or you’re giving guidance to an operator of a very big piece of machinery.

And so we really have AI across our whole business, including, by the way, in our factories on automation. One of the ways we mitigate risk there is we partner. We work with others so that they actually have de-risked a lot of the technologies. So you’ll see mobile robots from third parties, you’ll see collaborative robots from third parties that we’re customizing and putting to scale in our factories and de-risking them. So on that matrix, they’re much more distributed across the spectrum of risk.

Sam Ransbotham: One of the things that Shervin and I’ve talked about a few times is this idea how artificial intelligence maybe even steers people toward these incremental improvements. Maybe it’s the ability for these algorithms to improve an existing process [that] may somehow steer people toward the level one versus the level six. Are you seeing that? Are you able to get to apply artificial intelligence to these level five, level six types of projects?

Mark Maybury: We absolutely have AI across the spectrum. When it comes to AI, the stuff lower in the technical-commercial list tends to be commercially proven. So it tends to have multiple use cases: Others have deployed the technology; it’s been battle hardened. But the reality is, there’s whole a series of risks. And we actually have just recently published our responsible AI set of policies at the company and made them publicly available. So any other diversified industrial or tech company or other consulting small-to-medium enterprise can take a look at what we do. And I’ll give you a very simple example, and it gets a bit to your point of “Well, will they gravitate to the easier problems?” Well, not necessarily.

One of the areas of risk is making sure that your AI sensors or classifiers are in fact not biased and/or they’re resilient. And one of the ways you make sure they’re resilient and unbiased is you make sure that you have much more diversified data. That means if you have more users or more situations that are using your AI systems and there’s active learning going on — perhaps reinforcement learning while that machine’s operating, most likely human supervised, because you want to make sure that you’re not releasing anything that could adversely affect an operator or end user — actually, the more data you get, the better and more effective … the more risk you can reduce, but actually the higher performance you can get. So it’s a bit counterintuitive.

So you can actually become a bit more innovative in some sense, or just smarter in the AI case, because you have more exposure, in the same way that people who go through high school to university to graduate school, because their challenge is increased along those levels, their capacity to learn, to communicate, becomes much more effective as they go through that training. Same thing with a machine: You can give it easier examples, so they might be more incremental, simple challenges to that system, and as I get more difficult — so I go from the consumer, to the prosumer, to the pro — my intelligence of that system … because the pro knows a lot more. She’s been out working, constructing, for 20 years or building things in a factory for a long time and knows what kinds of learning that machine can leverage and can expose that machine to more sophisticated learning.

For example, for predictive analytics, if I want to predict an outage, if I’ve only seen one kind of outage, I will only be able to deal with that outage. If I’ve seen 30 different kinds of outages, I’m much better and much more resilient, because I know both what I know, but equally important — perhaps more important — I know what I don’t know. And if I see something for the first time, and I’ve seen 30 different things, and this is a brand-new one, I can say, “This doesn’t fit with anything I’ve seen. I’m ignorant. Hold up — let’s call a human. Tell them it’s an anomaly. Let’s get the machine to retrain.”

Sam Ransbotham: Where did these responsible principles come from? Is that something you developed internally, or is that something you’ve adopted from somewhere else?

Mark Maybury: So first, the motivation. Why do we care about responsible AI? It starts from some of my 31 years working in the public sector, understanding some of the risks of AI, having been on the government side funding a lot of startups, a lot of large companies and small companies, building defense applications and/or health care applications, national applications for AI. We recognized the fact that there are lots of failures. The way I think about the failures, which motivate responsible AI, is they can be your failure to … if you think of the OODA loop — observe, orient, decide, and act. Observation: You can have bad data, failed perception, bias, like I was suggesting. And so machines literally can be convinced that they’re seeing a yield sign when they see a stop sign. So there actually have been studies done that have demonstrated this.

Sam Ransbotham: Right, the adversarial.

Mark Maybury: Exactly: adversarial AI. You can also confuse an AI by biasing a selection, by mislabeling or misattributing things so they can be oriented in the wrong way. See, the classifications I talked about before: You could force them to see a different thing or misclassify. Similarly, they can decide poorly. They could have misinformation; there could be false cues or confusion. And we’ve seen this actually in the flash crash, where AIs were trained to actually do trading and then their model didn’t actually recognize when things were going bad, and poor decisions were made. And then finally, there can be physical world actions. We’ve had a couple of automated vehicles fail because of either failed human oversight of the AI, over-trusting the AI, or under-trusting the AI, and then poor decisions happen. And so that’s the motivation.

And then we studied work in Europe and Singapore and the World Economic Forum. In the U.S., there’s a whole bunch of work in AI principles, in algorithmic accountability, and White House guidance on regulation of AI. We’ve been connected into all of these things as well as connected to the Microsofts and the IBMs and the Googles of the world in terms of what they’re doing in terms of responsible AI. And we, as a diversified industrial, said, “We have these very complicated domain applications in manufacturing, in aviation, in transportation and tools, in home health care products or just home products, and so how do we make sure that when we are building AI into those system, we’re doing it in a responsible fashion?”

So that means making sure that we’re transparent in what the AI knows or doesn’t know; making sure that we protect the privacy of the information we’re collecting about the environment, perhaps, or the people; making sure that we’re equitable in our decisions and unbiased; making sure that the systems are more resilient, that they’re more symbiotic so we get at that augmented intelligence piece we talked about before. All of these are motivations for why, because we’re a company who really firmly believes in corporate social responsibility, and in order to achieve that, we have to actually build it into the products that we’re producing and the methods and the approaches we’re taking, which means making sure that we’re stress-testing those, that we’re designing them appropriately. So that’s the motivation for responsible AI.

Sam Ransbotham: What are you excited about at Stanley Black & Decker? What’s new? You mentioned projects you’ve worked on in the past. Anything exciting you can share that’s on the horizon?

Mark Maybury: I can’t go into great detail, but what I can say right now for your listeners is, we have some extreme innovation going on in the ESG [environmental, social, and governance] area, specifically when we’re talking about net zero. We’ve made public these statements that our factories will be carbon neutral by 2030. We have 120 factories and distribution centers around the world. … No government has told us to do that. That’s self-imposed. And by the way, if you think, “Oh, that’s a future thing; they’ll never do it,” we’re already ahead of target to get to 2030. But we’re also, by 2025, pulling in a little bit closer, we’re going to be plastic free in our packaging. So we’re getting rid of those blister packs that we all have gotten so accustomed to. Why? Because we want to get rid of microplastics in our water, in our oceans, and we feel that it’s our responsibility to take the initiative. No government has asked us to do this. It’s just that we think it’s the right thing to do.

We’re very, very actively learning right now about how we get materials that are carbon-free, how we operate our plants and design products that will be carbon-free, how we distribute things in a carbon-neutral way. This requires a complete rethinking, and it requires a lot of AI, actually, because you’ve got to think about smart design: Which components can I make to be reusable? Which can be recyclable? Which have to be compostable? The thing here is really to think outside the box. …

We’re a 179-year-old company, so we’ve been around for a while. And, as an officer of the company, my responsibility is as a steward, really, to make sure that we progress along the same values that Frederick Stanley, who was a social entrepreneur, the first mayor of New Britain [Connecticut], [who] turned his factories to building toys when there were no toys during the war for children … I mean, just a very community-minded individual. And that legacy, that purpose, continues on in what we do. And so, yes, we want high-power tools, and, yes, we want lightweight cars, and we want all those innovations, but we want them in a sustainable way.

Sam Ransbotham: Thank you. I think that many of your things about, for example, the different levels that you think about innovation will resonate with listeners. It’s been a great conversation. Thanks for joining us.

Shervin Khodabandeh: Mark, thanks. This has been really a great conversation.

Mark Maybury: Thank you very much.

Sam Ransbotham: We hope you enjoyed today’s episode. Next time, Shervin and I talk with Sanjay Nichani, vice president of artificial intelligence and computer vision at Peloton Interactive. Please join us.

Allison Ryder: Thanks for listening to Me, Myself, and AI. We believe, like you, that the conversation about AI implementation doesn’t start and stop with this podcast. That’s why we’ve created a group on LinkedIn, specifically for leaders like you. It’s called AI for Leaders, and if you join us, you can chat with show creators and hosts, ask your own questions, share insights, and gain access to valuable resources about AI implementation from MIT SMR and BCG. You can access it by visiting mitsmr.com/AIforLeaders. We’ll put that link in the show notes, and we hope to see you there.


During their conversation, Mark described how categorizing the technology-infused innovation projects he leads across the company into six levels, ranging from incremental improvements to radical innovations, helps Stanley Black & Decker balance its product development portfolio. He also shared some insights for organizations thinking about responsible AI guidelines and discussed how Stanley Black & Decker is increasing its focus on sustainability.


ABOUT THE HOSTS

Sam Ransbotham (@ransbotham) is a professor in the information systems department at the Carroll School of Management at Boston College, as well as guest editor for MIT Sloan Management Review’s Artificial Intelligence and Business Strategy Big Ideas initiative. Shervin Khodabandeh is a senior partner and managing director at BCG and the coleader of BCG GAMMA (BCG’s AI practice) in North America. He can be contacted at shervin@bcg.com.

Me, Myself, and AI is a collaborative podcast from MIT Sloan Management Review and Boston Consulting Group and is hosted by Sam Ransbotham and Shervin Khodabandeh. Our engineer is David Lishansky, and the coordinating producers are Allison Ryder and Sophie Rüdinger.

Content Source: MIT Sloan Management Review


RELATED CONTENT:

Desktop Metal Commences Shipments of Production System P-50 With Inaugural Customer Stanley Black & Decker

IN THE NEWS with Fastener News Desk the Week of February 28th, 2022

Featured, Technology

Read more...
manufacturing-pmi-at-53%;-june-2022-manufacturing-ism-report-on-business

Manufacturing PMI® at 53%; June 2022 Manufacturing ISM® Report On Business®

New Orders and Employment Contracting; Production and Backlogs Growing; Supplier Deliveries Slowing at a Slower Rate; Raw Materials Inventories Growing; Customers’ Inventories Too Low; Prices Increasing at a Slower Rate; Exports and Imports Growing; Record-Long Lead Times for Capital Expenditures and Production Materials

,  /PRNewswire/ — Economic activity in the manufacturing sector grew in June, with the overall economy achieving a 25th consecutive month of growth, say the nation’s supply executives in the latest Manufacturing ISM® Report On Business®.

The report was issued today by Timothy R. Fiore, CPSM, C.P.M., Chair of the Institute for Supply Management® (ISM®) Manufacturing Business Survey Committee:

“The June Manufacturing PMI® registered 53 percent, down 3.1 percentage points from the reading of 56.1 percent in May. This figure indicates expansion in the overall economy for the 25th month in a row after a contraction in April and May 2020. This is the lowest Manufacturing PMI® reading since June 2020, when it registered 52.4 percent. The New Orders Index reading of 49.2 percent is 5.9 percentage points lower than the 55.1 percent recorded in May. The Production Index reading of 54.9 percent is a 0.7-percentage point increase compared to May’s figure of 54.2 percent. The Prices Index registered 78.5 percent, down 3.7 percentage points compared to the May figure of 82.2 percent. The Backlog of Orders Index registered 53.2 percent, 5.5 percentage points below the May reading of 58.7 percent. The Employment Index contracted for a second straight month at 47.3 percent, 2.3 percentage points lower than the 49.6 percent recorded in May. The Supplier Deliveries Index reading of 57.3 percent is 8.4 percentage points lower than the May figure of 65.7 percent. The Inventories Index registered 56 percent, 0.1 percentage point higher than the May reading of 55.9 percent. The New Export Orders Index reading of 50.7 percent is down 2.2 percentage points compared to May’s figure of 52.9 percent. The Imports Index climbed into expansion territory, up 2 percentage points to 50.7 percent from 48.7 percent in May.”

Fiore continues, “The U.S. manufacturing sector continues to be powered — though less so in June — by demand while held back by supply chain constraints. Despite the Employment Index contracting in May and June, companies improved their progress on addressing moderate-term labor shortages at all tiers of the supply chain, according to Business Survey Committee respondents’ comments. Panelists reported lower rates of quits compared to May. Prices expansion slightly eased for a third straight month in June, but instability in global energy markets continues. Sentiment remained optimistic regarding demand, with three positive growth comments for every cautious comment. Panelists continue to note supply chain and pricing issues as their biggest concerns. Demand dropped, with the (1) New Orders Index contracting, (2) Customers’ Inventories Index remaining at a very low level, though it increased and (3) Backlog of Orders Index decreasing but still in growth territory. Consumption (measured by the Production and Employment indexes) was mixed during the period, with a combined minus-1.6-percentage point change to the Manufacturing PMI® calculation. The Employment Index contracted for the second month in a row after expanding for eight straight months (September through April), but panelists again indicated month-over-month improvement in ability to hire in June. Challenges with turnover (quits and retirements) and resulting backfilling continue to plague efforts to adequately staff organizations, but to a lesser degree compared to the previous month. Inputs — expressed as supplier deliveries, inventories and imports — continued to constrain production expansion but to a lesser extent compared to May. The Supplier Deliveries Index indicated deliveries slowed at a slower rate in June, which was supported by a slight increase in the Inventories Index. The Imports Index expanded in June after one month of contraction preceded by six consecutive months of expansion. The Prices Index increased for the 25th consecutive month, at a slower rate compared to May.

“All of the six biggest manufacturing industries — Computer & Electronic Products; Machinery; Transportation Equipment; Petroleum & Coal Products; Food, Beverage & Tobacco Products; and Chemical Products — registered moderate-to-strong growth in June.

“Manufacturing performed well for the 25th straight month. There are signs of new order rate softening — cited in 17 percent of general comments, compared to 10 percent in May — but the root cause is difficult to determine: (1) demand reduction, (2) adjustment for excessive lead times, causing order rate adjustments or (3) a combination of both. Employment activity remain strongly positive in spite of the uncertainty with new order rates,” says Fiore.

Fifteen manufacturing industries reported growth in June, in the following order: Apparel, Leather & Allied Products; Textile Mills; Printing & Related Support Activities; Computer & Electronic Products; Machinery; Electrical Equipment, Appliances & Components; Primary Metals; Nonmetallic Mineral Products; Plastics & Rubber Products; Transportation Equipment; Fabricated Metal Products; Miscellaneous Manufacturing; Petroleum & Coal Products; Food, Beverage & Tobacco Products; and Chemical Products. The three industries reporting contraction in June compared to May are: Paper Products; Wood Products; and Furniture & Related Products.

WHAT RESPONDENTS ARE SAYING

  • “Backlog is high, but incoming orders slowing this month.” [Computer & Electronic Products]
  • “New orders have stabilized and not increased.” [Chemical Products]
  • “Continued strong demand for transportation equipment.” [Transportation Equipment]
  • “Business is slower than expected in volume, but revenue is on pace with our budget. Ocean freight costs are finally beginning to fall a bit. We are already receiving large orders for the fall, which is encouraging.” [Food, Beverage & Tobacco Products]
  • “Continued tightening of market, rising gas/diesel prices, and limited labor/drivers equates to increased cost. Few markets showing a levelling off.” [Petroleum & Coal Products]
  • “Our suppliers are experiencing a softening of orders. We are still running at the same high level we did throughout 2021 and in early 2022.” [Machinery]
  • “Business is still steady. Some customers are pushing orders out because they have too much inventory. We are able to backfill the pushed orders from customers that want theirs earlier, so we aren’t losing capacity.” [Fabricated Metal Products]
  • “We are hearing from customers that their inventories are high, and sales are coming down. We expect orders to decline on the coming months until inventories are leveled properly against demand.” [Apparel, Leather & Allied Products]
  • “Orders and production continue to be strong, but material availability is holding us back. Cannot run enough hours to eat into the backlog.” [Electrical Equipment, Appliances & Components]
  • “Supply seems to be settling to some degree, but what it is settling into remains in question. Diminishing cost and (continued) limited supply in aluminum make for an interesting combination. There are actually more questions than answers this month.” [Primary Metals]

MANUFACTURING AT A GLANCEJune 2022

Index

Series

Index

Jun

Series

Index

May

Percentage

Point

Change

Direction

Rate of

Change

Trend*

(Months)

Manufacturing PMI®

53.0

56.1

-3.1

Growing

Slower

25

New Orders

49.2

55.1

-5.9

Contracting

From Growing

1

Production

54.9

54.2

+0.7

Growing

Faster

25

Employment

47.3

49.6

-2.3

Contracting

Faster

2

Supplier Deliveries

57.3

65.7

-8.4

Slowing

Slower

76

Inventories

56.0

55.9

+0.1

Growing

Faster

11

Customers’ Inventories

35.2

32.7

+2.5

Too Low

Slower

69

Prices

78.5

82.2

-3.7

Increasing

Slower

25

Backlog of Orders

53.2

58.7

-5.5

Growing

Slower

24

New Export Orders

50.7

52.9

-2.2

Growing

Slower

24

Imports

50.7

48.7

+2.0

Growing

From Contracting

1

OVERALL ECONOMY

Growing

Slower

25

Manufacturing Sector

Growing

Slower

25

Manufacturing ISM® Report On Business® data is seasonally adjusted for the New Orders, Production, Employment and Inventories indexes.

*Number of months moving in current direction.

COMMODITIES REPORTED UP/DOWN IN PRICE AND IN SHORT SUPPLY

Commodities Up in PriceAdhesives and Paint (7); Aluminum* (25); Caustic Soda (4); Corrugate (5); Corrugated Packaging (20); Crude Oil (2); Diesel Fuel (18); Electrical Components (19); Electricity; Electronic Components (19); Energy (4); Freight (20); High-Density Polyethylene (HDPE) Resin; Labor — Temporary (14); Lumber* (7); Natural Gas (12); Packaging Supplies (19); Paper (4); Petroleum Based Products (2); Pigments and Dyes; Resin Based Products (3); Plastic Resins* (6); Rubber Based Products (11); Steel* (23); Steel — Fabricated & Machined Components (2); Steel — Stainless (20); Steel Castings; Steel Products (22); and Synthetic Rubber.

Commodities Down in PriceAluminum* (2); Lumber*; Ocean Freight; Plastic Resins*; Steel* (2); Steel — Cold Rolled; Steel — Hot Rolled (2); and Steel — Scrap (2).

Commodities in Short SupplyElectric Motors; Electrical Components (21); Electronic Components (19); Hydraulic Components (2); Labor — Temporary (14); Packaging Products (2); Paper (3); Plastic Resins (2); Rubber Based Products; Semiconductors (19); Steel — Fabricated & Machined Components (2); Steel — Stainless; and Steel Products (3).

Note: The number of consecutive months the commodity is listed is indicated after each item.

*Indicates both up and down in price.

JUNE 2022 MANUFACTURING INDEX SUMMARIES

Manufacturing PMI®Manufacturing grew in June, as the Manufacturing PMI® registered 53 percent, 3.1 percentage points lower than the May reading of 56.1 percent. “The Manufacturing PMI® continued to indicate sector expansion and U.S. economic growth in June. Three of the five subindexes that directly factor into the Manufacturing PMI® were in growth territory. All of the six biggest manufacturing industries registered moderate-to-strong growth in June, in this order: Computer & Electronic Products; Machinery; Transportation Equipment; Petroleum & Coal Products; Food, Beverage & Tobacco Products; and Chemical Products. The Production Index increased at a slightly faster rate. The Supplier Deliveries Index slowed at a slower rate while the Inventories Index increased slightly, indicating somewhat easing supply chain congestion. Eight of the 10 subindexes were positive for the period; a reading of ‘too low’ for the Customers’ Inventories Index is considered a positive for future production,” says Fiore. A reading above 50 percent indicates that the manufacturing economy is generally expanding; below 50 percent indicates that it is generally contracting.

A Manufacturing PMI® above 48.7 percent, over a period of time, generally indicates an expansion of the overall economy. Therefore, the June Manufacturing PMI® indicates the overall economy grew in June for the 25th consecutive month following contraction in April and May 2020. “The past relationship between the Manufacturing PMI® and the overall economy indicates that the Manufacturing PMI® for June (53 percent) corresponds to a 1.5-percent increase in real gross domestic product (GDP) on an annualized basis,” says Fiore.

THE LAST 12 MONTHS

Month

Manufacturing

PMI®


Month

Manufacturing

PMI®

Jun 2022

53.0


Dec 2021

58.8

May 2022

56.1


Nov 2021

60.6

Apr 2022

55.4


Oct 2021

60.8

Mar 2022

57.1


Sep 2021

60.5

Feb 2022

58.6


Aug 2021

59.7

Jan 2022

57.6


Jul 2021

59.9

Average for 12 months – 58.2

High – 60.8

Low – 53.0

New OrdersISM®‘s New Orders Index dropped to 49.2 percent in June, a decrease of 5.9 percentage points compared to the 55.1 percent reported in May. This indicates that new order volumes contracted after growing for 24 consecutive months. “Two of the six largest manufacturing sectors — Petroleum & Coal Products; and Computer & Electronic Products — increased new orders at moderate-to-strong levels. Price elevation and extended lead times resulted in a continuing slowing in new order rates across the supply chain. Backlog sagged in the month due to the weakness in new orders,” says Fiore. A New Orders Index above 52.9 percent, over time, is generally consistent with an increase in the Census Bureau’s series on manufacturing orders (in constant 2000 dollars).

Of the 18 manufacturing industries, eight reported growth in new orders in June, in the following order: Textile Mills; Apparel, Leather & Allied Products; Nonmetallic Mineral Products; Petroleum & Coal Products; Primary Metals; Plastics & Rubber Products; Computer & Electronic Products; and Miscellaneous Manufacturing. Seven industries reported a decline in new orders in June, in the following order: Wood Products; Furniture & Related Products; Paper Products; Transportation Equipment; Electrical Equipment, Appliances & Components; Chemical Products; and Food, Beverage & Tobacco Products.

New Orders

%Higher

%Same

%Lower

Net

Index

Jun 2022

17.8

65.1

17.1

+0.7

49.2

May 2022

28.2

58.5

13.3

+14.9

55.1

Apr 2022

25.1

64.0

10.9

+14.2

53.5

Mar 2022

28.2

60.4

11.4

+16.8

53.8

ProductionThe Production Index registered 54.9 percent in June, 0.7 percentage point higher than the May reading of 54.2 percent, indicating growth for the 25th consecutive month. “Of the top six industries, four —Petroleum & Coal Products; Computer & Electronic Products; Transportation Equipment; and Chemical Products — expanded in June. Hiring and materials availability continue to show signs of recovery, but factories are still struggling to hit optimum output rates — primarily due to high levels of employee turnover,” says Fiore. An index above 52.4 percent, over time, is generally consistent with an increase in the Federal Reserve Board’s Industrial Production figures.

Ten industries reported growth in production during the month of June, in the following order: Apparel, Leather & Allied Products; Printing & Related Support Activities; Petroleum & Coal Products; Nonmetallic Mineral Products; Computer & Electronic Products; Transportation Equipment; Electrical Equipment, Appliances & Components; Chemical Products; Plastics & Rubber Products; and Fabricated Metal Products. The three industries reporting a decrease in production in June are: Textile Mills; Paper Products; and Furniture & Related Products.

Production

%Higher

%Same

%Lower

Net

Index

Jun 2022

27.4

60.9

11.7

+15.7

54.9

May 2022

23.9

59.2

16.9

+7.0

54.2

Apr 2022

27.5

61.0

11.5

+16.0

53.6

Mar 2022

25.7

62.3

12.0

+13.7

54.5

EmploymentISM®‘s Employment Index registered 47.3 percent in June, 2.3 percentage points below the May reading of 49.6 percent. “The index contracted for a second straight month after an eight-month period of expansion. This is the lowest reading since August 2020, when the index registered 47.1 percent. Of the six big manufacturing sectors, two (Computer & Electronic Products; and Food, Beverage & Tobacco Products) expanded. Survey panelists’ companies are still struggling to meet labor management plans, though there are more signs of improvement: A larger share of comments (14 percent in June, up from 7 percent in May) noted greater hiring ease. An overwhelming majority of panelists again indicate their companies are hiring. Among those respondents, 42 percent expressed difficulty in filling positions, up from 30 percent in May. Turnover rates remain elevated (29 percent of comments cited backfills and retirements, a decrease from 36 percent in May). Employment levels, driven primarily by turnover, remain the top issue affecting further output growth,” says Fiore. An Employment Index above 50.5 percent, over time, is generally consistent with an increase in the Bureau of Labor Statistics (BLS) data on manufacturing employment.

Nine of 18 manufacturing industries reported employment growth in June, in the following order: Nonmetallic Mineral Products; Apparel, Leather & Allied Products; Printing & Related Support Activities; Textile Mills; Plastics & Rubber Products; Computer & Electronic Products; Fabricated Metal Products; Electrical Equipment, Appliances & Components; and Food, Beverage & Tobacco Products. The six industries reporting a decrease in employment in June — in the following order — are: Paper Products; Petroleum & Coal Products; Furniture & Related Products; Miscellaneous Manufacturing; Chemical Products; and Transportation Equipment.

Employment

%Higher

%Same

%Lower

Net

Index

Jun 2022

17.9

63.7

18.4

-0.5

47.3

May 2022

21.8

55.4

22.8

-1.0

49.6

Apr 2022

21.0

61.9

17.1

+3.9

50.9

Mar 2022

24.4

65.2

10.4

+14.0

56.3

Supplier DeliveriesThe delivery performance of suppliers to manufacturing organizations was slower in June, as the Supplier Deliveries Index registered 57.3 percent, 8.4 percentage points lower than the 65.7 percent reported in May. Five of the top six manufacturing industries (Machinery; Computer & Electronic Products; Food, Beverage & Tobacco Products; Transportation Equipment; and Chemical Products) reported slower deliveries. “Deliveries slowed at a slower rate compared to the previous month. The index continues to reflect suppliers’ difficulties in meeting demand from panelists’ companies, but there are clear signs of easing. In June, suppliers remained in a labor-constrained environment, based on panelists’ comments and the Employment Index remaining in contraction territory. Transportation networks reflected improvement compared to May. Among supplier delivery comments, 6 percent noted stable month-over-month improvement,” says Fiore. A reading below 50 percent indicates faster deliveries, while a reading above 50 percent indicates slower deliveries.

Fourteen of 18 manufacturing industries reported slower supplier deliveries in June, in the following order: Textile Mills; Furniture & Related Products; Apparel, Leather & Allied Products; Machinery; Printing & Related Support Activities; Primary Metals; Computer & Electronic Products; Paper Products; Miscellaneous Manufacturing; Food, Beverage & Tobacco Products; Transportation Equipment; Electrical Equipment, Appliances & Components; Fabricated Metal Products; and Chemical Products. Three industries reported faster supplier deliveries in June as compared to May: Nonmetallic Mineral Products; Wood Products; and Petroleum & Coal Products.

Supplier Deliveries

%Slower

%Same

%Faster

Net

Index

Jun 2022

27.4

59.8

12.8

+14.6

57.3

May 2022

37.1

57.2

5.7

+31.4

65.7

Apr 2022

38.7

57.0

4.3

+34.4

67.2

Mar 2022

34.8

61.2

4.0

+30.8

65.4

InventoriesThe Inventories Index registered 56 percent in June, 0.1 percentage point higher than the 55.9 percent reported for May. “Manufacturing inventories expanded at a slightly faster rate compared to May. Of the six big manufacturing industries, four (Computer & Electronic Products; Machinery; Chemical Products; and Transportation Equipment) grew their inventories of manufacturing raw materials in June. Companies report a continued willingness to take early delivery of raw materials as well as building extra work in process to support quick conversion,” says Fiore. An Inventories Index greater than 44.4 percent, over time, is generally consistent with expansion in the Bureau of Economic Analysis (BEA) figures on overall manufacturing inventories (in chained 2000 dollars).

Of 18 manufacturing industries, the eight reporting higher inventories in June — in the following order — are: Textile Mills; Apparel, Leather & Allied Products; Computer & Electronic Products; Machinery; Electrical Equipment, Appliances & Components; Chemical Products; Transportation Equipment; and Miscellaneous Manufacturing. The three industries reporting contracting inventories in June are: Paper Products; Nonmetallic Mineral Products; and Primary Metals. Seven industries reported no change in inventories in June as compared to May.

Inventories

%Higher

%Same

%Lower

Net

Index

Jun 2022

25.4

59.8

14.8

+10.6

56.0

May 2022

24.3

62.5

13.2

+11.1

55.9

Apr 2022

21.4

61.4

17.2

+4.2

51.6

Mar 2022

24.5

63.6

11.9

+12.6

55.5

Customers’ InventoriesISM®‘s Customers’ Inventories Index registered 35.2 percent in June, 2.5 percentage points higher than the 32.7 percent reported for May, indicating that customers’ inventory levels were considered much too low. “Customers’ inventories are too low for the 69th consecutive month, a positive for future production growth. For 23 straight months, the Customers’ Inventories Index has been at historically low levels,” says Fiore.

Two industries (Apparel, Leather & Allied Products; and Wood Products) reported customers’ inventories as too high in June. The 14 industries reporting customers’ inventories as too low during June — listed in order — are: Textile Mills; Nonmetallic Mineral Products; Primary Metals; Machinery; Computer & Electronic Products; Electrical Equipment, Appliances & Components; Transportation Equipment; Miscellaneous Manufacturing; Plastics & Rubber Products; Petroleum & Coal Products; Furniture & Related Products; Food, Beverage & Tobacco Products; Fabricated Metal Products; and Chemical Products.

Customers’

Inventories

%

Reporting

%Too

High

%About

Right

%Too

Low

Net

Index

Jun 2022

75

11.1

48.1

40.8

-29.7

35.2

May 2022

75

12.8

39.7

47.5

-34.7

32.7

Apr 2022

76

10.5

53.2

36.3

-25.8

37.1

Mar 2022

69

7.3

53.6

39.1

-31.8

34.1

PricesThe ISM® Prices Index registered 78.5 percent, 3.7 percentage points lower compared to the May reading of 82.2 percent, indicating raw materials prices increased for the 25th consecutive month, at a slower rate in June. The Prices Index has exceeded 70 percent in 18 out of the last 19 months and been above 60 percent for 22 straight months. “Continued oil and fuel price increases, packaging supplies (including corrugate), food ingredients, and petroleum-based products and petrochemicals were the primary causes of prices growth. Notably, 8.3 percent of respondents reported lower prices in June, supporting a continued slow but steady move towards price softening,” says Fiore. A Prices Index above 52.6 percent, over time, is generally consistent with an increase in the Bureau of Labor Statistics (BLS) Producer Price Index for Intermediate Materials. 

In June, 17 of 18 industries reported paying increased prices for raw materials, in the following order: Petroleum & Coal Products; Textile Mills; Paper Products; Plastics & Rubber Products; Miscellaneous Manufacturing; Nonmetallic Mineral Products; Chemical Products; Electrical Equipment, Appliances & Components; Furniture & Related Products; Apparel, Leather & Allied Products; Printing & Related Support Activities; Machinery; Computer & Electronic Products; Food, Beverage & Tobacco Products; Transportation Equipment; Primary Metals; and Fabricated Metal Products. No industry reported paying decreased prices for raw materials in June.

Prices

%Higher

%Same

%Lower

Net

Index

Jun 2022

65.2

26.5

8.3

+56.9

78.5

May 2022

70.2

24.2

5.6

+64.6

82.2

Apr 2022

73.5

22.1

4.4

+69.1

84.6

Mar 2022

75.1

24.0

0.9

+74.2

87.1

Backlog of OrdersISM®‘s Backlog of Orders Index registered 53.2 percent in June, a 5.5-percentage point decrease compared to the 58.7 percent reported in May, indicating order backlogs expanded for the 24th straight month. Of the six largest manufacturing sectors, three — Petroleum & Coal Products; Machinery; and Computer & Electronic Products — expanded their order backlogs. “Backlogs expanded in June at a slower rate, as output remains stable at relatively low levels and new orders have slowed due to excessive lead times and historically high prices,” says Fiore.

Nine industries reported growth in order backlogs in June, in the following order: Apparel, Leather & Allied Products; Printing & Related Support Activities; Petroleum & Coal Products; Textile Mills; Electrical Equipment, Appliances & Components; Machinery; Primary Metals; Computer & Electronic Products; and Miscellaneous Manufacturing. The four industries reporting lower backlogs in June are: Furniture & Related Products; Paper Products; Fabricated Metal Products; and Chemical Products.

Backlog of

Orders

%Reporting

%Higher

%Same

%Lower

Net

Index

Jun 2022

93

25.6

55.3

19.1

+6.5

53.2

May 2022

91

31.6

54.3

14.1

+17.5

58.7

Apr 2022

92

27.9

56.3

15.8

+12.1

56.0

Mar 2022

92

29.8

60.4

9.8

+20.0

60.0

New Export OrdersISM®‘s New Export Orders Index registered 50.7 percent in June, 2.2 percentage points below the May reading of 52.9 percent. “The New Export Orders Index grew for the 24th consecutive month, at a slower rate in June. For the fourth straight month, COVID-19 in China has suppressed customer demand from overseas, and the war in Ukraine has limited European demand. Of the six big industry sectors, two — Food, Beverage & Tobacco Products; and Computer & Electronic Products — expanded,” says Fiore.

The five industries reporting growth in new export orders in June are: Paper Products; Food, Beverage & Tobacco Products; Computer & Electronic Products; Electrical Equipment, Appliances & Components; and Fabricated Metal Products. The five industries reporting a decrease in new export orders in June are: Wood Products; Primary Metals; Machinery; Transportation Equipment; and Miscellaneous Manufacturing. Six industries reported no change in exports in June as compared to May.

New Export

Orders

%

Reporting

%Higher

%Same

%Lower

Net

Index

Jun 2022

72

12.3

76.8

10.9

+1.4

50.7

May 2022

73

14.6

76.6

8.8

+5.8

52.9

Apr 2022

73

10.7

84.1

5.2

+5.5

52.7

Mar 2022

72

14.3

77.7

8.0

+6.3

53.2

ImportsISM®‘s Imports Index registered 50.7 percent in June after contracting in May, an increase of 2 percentage points compared to May’s figure of 48.7 percent. “Imports grew marginally in June. Import demand remains strong entering the back-to-school and holiday import seasons,” says Fiore.

The 12 industries reporting growth in imports in June — in the following order — are: Apparel, Leather & Allied Products; Printing & Related Support Activities; Furniture & Related Products; Primary Metals; Plastics & Rubber Products; Food, Beverage & Tobacco Products; Transportation Equipment; Computer & Electronic Products; Machinery; Miscellaneous Manufacturing; Electrical Equipment, Appliances & Components; and Fabricated Metal Products. Three industries reported lower volumes of imports in June: Petroleum & Coal Products; Paper Products; and Chemical Products.

Imports

%

Reporting

%Higher

%Same

%Lower

Net

Index

Jun 2022

84

14.4

72.5

13.1

+1.3

50.7

May 2022

85

13.4

70.6

16.0

-2.6

48.7

Apr 2022

83

13.2

76.5

10.3

+2.9

51.4

Mar 2022

83

15.2

73.1

11.7

+3.5

51.8

The Supplier Deliveries, Customers’ Inventories, Prices, Backlog of Orders, New Export Orders, and Imports indexes do not meet the accepted criteria for seasonal adjustments.

Buying PolicyThe average commitment lead time for Capital Expenditures in June was 186 days, an increase of eight days compared to May and another all-time high. (ISM® began tracking lead times data in 1987.) CapEx lead times have increased in 10 of the last 12 months, for a net gain of 38 days since July 2021 (148 days). Average lead time in June for Production Materials increased by one day to return to its all-time high of 100 days. Average lead time for Maintenance, Repair and Operating (MRO) Supplies decreased by four days, to 44 days.

Percent Reporting

Capital

Expenditures

Hand-to-

Mouth

30 Days

60 Days

90 Days

6 Months

1 Year+

Average

Days

Jun 2022

15

6

7

9

31

32

186

May 2022

17

5

8

10

30

30

178

Apr 2022

18

4

6

14

30

28

173

Mar 2022

18

3

8

14

29

28

172

Percent Reporting

Production

Materials

Hand-to-

Mouth

30 Days

60 Days

90 Days

6 Months

1 Year+

Average

Days

Jun 2022

8

19

23

25

18

7

100

May 2022

9

21

21

26

15

8

99

Apr 2022

9

16

26

24

18

7

100

Mar 2022

8

21

23

26

15

7

96

Percent Reporting

MRO Supplies

Hand-to-

Mouth

30 Days

60 Days

90 Days

6 Months

1 Year+

Average

Days

Jun 2022

25

39

19

12

5

44

May 2022

27

35

19

12

6

1

48

Apr 2022

24

33

23

15

4

1

49

Mar 2022

24

33

22

16

5

48

About This ReportDO NOT CONFUSE THIS NATIONAL REPORT with the various regional purchasing reports released across the country. The national report’s information reflects the entire U.S., while the regional reports contain primarily regional data from their local vicinities. Also, the information in the regional reports is not used in calculating the results of the national report. The information compiled in this report is for the month of June 2022.

The data presented herein is obtained from a survey of manufacturing supply executives based on information they have collected within their respective organizations. ISM® makes no representation, other than that stated within this release, regarding the individual company data collection procedures. The data should be compared to all other economic data sources when used in decision-making.

Data and Method of PresentationThe Manufacturing ISM® Report On Business® is based on data compiled from purchasing and supply executives nationwide. The composition of the Manufacturing Business Survey Committee is stratified according to the North American Industry Classification System (NAICS) and each of the following NAICS-based industry’s contribution to gross domestic product (GDP): Food, Beverage & Tobacco Products; Textile Mills; Apparel, Leather & Allied Products; Wood Products; Paper Products; Printing & Related Support Activities; Petroleum & Coal Products; Chemical Products; Plastics & Rubber Products; Nonmetallic Mineral Products; Primary Metals; Fabricated Metal Products; Machinery; Computer & Electronic Products; Electrical Equipment, Appliances & Components; Transportation Equipment; Furniture & Related Products; and Miscellaneous Manufacturing (products such as medical equipment and supplies, jewelry, sporting goods, toys and office supplies). The data are weighted based on each industry’s contribution to GDP. According to the BEA estimates for 2020 GDP (released December 22, 2021), the six largest manufacturing subsectors are: Computer & Electronic Products; Chemical Products; Transportation Equipment; Petroleum & Coal Products; Food, Beverage & Tobacco Products; and Machinery. Beginning in February 2018 with January 2018 data, computation of the indexes is accomplished utilizing unrounded numbers.

Survey responses reflect the change, if any, in the current month compared to the previous month. For each of the indicators measured (New Orders, Backlog of Orders, New Export Orders, Imports, Production, Supplier Deliveries, Inventories, Customers’ Inventories, Employment and Prices), this report shows the percentage reporting each response, the net difference between the number of responses in the positive economic direction (higher, better and slower for Supplier Deliveries) and the negative economic direction (lower, worse and faster for Supplier Deliveries), and the diffusion index. Responses are raw data and are never changed. The diffusion index includes the percent of positive responses plus one-half of those responding the same (considered positive).

The resulting single index number for those meeting the criteria for seasonal adjustments (Manufacturing PMI®, New Orders, Production, Employment and Inventories) is then seasonally adjusted to allow for the effects of repetitive intra-year variations resulting primarily from normal differences in weather conditions, various institutional arrangements, and differences attributable to non-moveable holidays. All seasonal adjustment factors are subject annually to relatively minor changes when conditions warrant them. The Manufacturing PMI® is a composite index based on the diffusion indexes of five of the indexes with equal weights: New Orders (seasonally adjusted), Production (seasonally adjusted), Employment (seasonally adjusted), Supplier Deliveries, and Inventories (seasonally adjusted).

Diffusion indexes have the properties of leading indicators and are convenient summary measures showing the prevailing direction of change and the scope of change. A Manufacturing PMI® reading above 50 percent indicates that the manufacturing economy is generally expanding; below 50 percent indicates that it is generally declining. A Manufacturing PMI® above 48.7 percent, over a period of time, indicates that the overall economy, or gross domestic product (GDP), is generally expanding; below 48.7 percent, it is generally declining. The distance from 50 percent or 48.7 percent is indicative of the extent of the expansion or decline. With some of the indicators within this report, ISM® has indicated the departure point between expansion and decline of comparable government series, as determined by regression analysis. The Manufacturing ISM® Report On Business® survey is sent out to Manufacturing Business Survey Committee respondents the first part of each month. Respondents are asked to report on information for the current month for U.S. operations only. ISM® receives survey responses throughout most of any given month, with the majority of respondents generally waiting until late in the month to submit responses to give the most accurate picture of current business activity. ISM® then compiles the report for release on the first business day of the following month.

The industries reporting growth, as indicated in the Manufacturing ISM® Report On Business® monthly report, are listed in the order of most growth to least growth. For the industries reporting contraction or decreases, those are listed in the order of the highest level of contraction/decrease to the least level of contraction/decrease.

Responses to Buying Policy reflect the percent reporting the current month’s lead time, the approximate weighted number of days ahead for which commitments are made for Capital Expenditures; Production Materials; and Maintenance, Repair and Operating (MRO) Supplies, expressed as hand-to-mouth (five days), 30 days, 60 days, 90 days, six months (180 days), a year or more (360 days), and the weighted average number of days. These responses are raw data, never revised, and not seasonally adjusted.

ISM ROB ContentThe Institute for Supply Management® (“ISM”) Report On Business® (both Manufacturing and Non-Manufacturing) (“ISM ROB”) contains information, text, files, images, video, sounds, musical works, works of authorship, applications, and any other materials or content (collectively, “Content”) of ISM (“ISM ROB Content”). ISM ROB Content is protected by copyright, trademark, trade secret, and other laws, and as between you and ISM, ISM owns and retains all rights in the ISM ROB Content. ISM hereby grants you a limited, revocable, nonsublicensable license to access and display on your individual device the ISM ROB Content (excluding any software code) solely for your personal, non-commercial use. The ISM ROB Content shall also contain Content of users and other ISM licensors. Except as provided herein or as explicitly allowed in writing by ISM, you shall not copy, download, stream, capture, reproduce, duplicate, archive, upload, modify, translate, publish, broadcast, transmit, retransmit, distribute, perform, display, sell, or otherwise use any ISM ROB Content.

Except as explicitly and expressly permitted by ISM, you are strictly prohibited from creating works or materials (including but not limited to tables, charts, data streams, time-series variables, fonts, icons, link buttons, wallpaper, desktop themes, online postcards, montages, mashups and similar videos, greeting cards, and unlicensed merchandise) that derive from or are based on the ISM ROB Content. This prohibition applies regardless of whether the derivative works or materials are sold, bartered, or given away. You shall not either directly or through the use of any device, software, internet site, web-based service, or other means remove, alter, bypass, avoid, interfere with, or circumvent any copyright, trademark, or other proprietary notices marked on the Content or any digital rights management mechanism, device, or other content protection or access control measure associated with the Content including geo-filtering mechanisms. Without prior written authorization from ISM, you shall not build a business utilizing the Content, whether or not for profit.

You shall not create, recreate, distribute, incorporate in other work, or advertise an index of any portion of the Content unless you receive prior written authorization from ISM. Requests for permission to reproduce or distribute ISM ROB Content can be made by contacting in writing at: ISM Research, Institute for Supply Management, 309 West Elliot Road, Suite 113, Tempe, Arizona 85284-1556, or by emailing kcahill@ismworld.org. Subject: Content Request.

ISM shall not have any liability, duty, or obligation for or relating to the ISM ROB Content or other information contained herein, any errors, inaccuracies, omissions or delays in providing any ISM ROB Content, or for any actions taken in reliance thereon. In no event shall ISM be liable for any special, incidental, or consequential damages, arising out of the use of the ISM ROB. Report On Business®, PMI®, and NMI® are registered trademarks of Institute for Supply Management®. Institute for Supply Management® and ISM® are registered trademarks of Institute for Supply Management, Inc.

About Institute for Supply Management®Institute for Supply Management® (ISM®) serves supply management professionals in more than 90 countries. Its 50,000 members around the world manage about US$1 trillion in corporate and government supply chain procurement annually. Founded in 1915 as the first supply management institute in the world, ISM is committed to advancing the practice of supply management to drive value and competitive advantage for its members, contributing to a prosperous and sustainable world. ISM leads the profession through the ISM® Report On Business®, its highly regarded certification programs and the ISM® Advance Digital Platform. This report has been issued by the association since 1931, except for a four-year interruption during World War II.

The full text version of the Manufacturing ISM® Report On Business® is posted on ISM®‘s website at www.ismrob.org on the first business day* of every month after 10:00 a.m. ET.

The next Manufacturing ISM® Report On Business® featuring July 2022 data will be released at 10:00 a.m. ET on Monday, August 1, 2022.

*Unless the New York Stock Exchange is closed.

Contact:

Kristina Cahill


Report On Business® Analyst


ISM®, ROB/Research Manager


Tempe, Arizona


+1 480.455.5910


Email: kcahill@ismworld.org


SOURCE Institute for Supply Management

Featured, Manufacturing

Read more...
gilchrist-foundation-awards-2022-scholarships

Gilchrist Foundation Awards 2022 Scholarships

June 20, 2022

The Gilchrist Foundation has awarded four scholarships from the 2022 applicants. 

Congratulations to the recipients. We wish them well and are pleased to assist them with their education. They are as follows and their sponsoring companies;

Kyndal Shannon, Hercules Bolt

Issayana Camacho, Kanebridge Corp

Myles Prodoehl, Valley Fastener Group

Maxton Blackburn, Hanger Bolt & Stud

Robbie and Gina Gilchrist established the Gilchrist Foundation Fastener Scholarship in 2000. Their goal was to return something to an industry that was very good and supportive to them. The Gilchrist Foundation invites any person wanting to further their education to apply for the scholarships. Applicants can be full time or part time students working in the industry or children of working fastener people. The Foundation has awarded 76 scholarships since its beginning!

About Gilchrist Foundation: Providing scholarships and leadership opportunities for persons engaged in or pursuing careers in the fasteners industry.

Origins of the Foundation:

In 1972 Robbie Gilchrist graduated from high school and took a summer job in the fasteners industry. He intended to go to college, but the summer job lasted 13 years until he ventured out to start his own fastener distributorship.

In 1985 Gilchrist refinanced his house, borrowed from friends and took out a Small Business Administration loan to start Capital Fasteners Inc. in High Point, North Carolina.

Robbie met his wife, Gina, while she was also working in the fastener business. As the fledgling company grew, Gina established her own career outside the industry to provide a household income while Robbie built the distributorship.

After great success, Gilchrist sold the thriving enterprise to Questron Technology, Inc. in 1999 after expanding the business to include branches in Chesapeake, VA, and Jacksonville, FL.

Robbie Gilchrist never did receive a four year college degree, but he and Gina decided to assist future students by forming the Gilchrist Foundation. Scholarships are awarded to those who are already engaged in the fastener industry to continue their education. Children of fastener industry employees who intend to go into the fastener business can also benefit from the foundation.

As Robbie states: “We genuinely wanted to give back and give from the heart; we have enjoyed tremendous success and opportunity in the fastener industry, so it is only fitting for us to allow others to benefit.”

For additional information visit the foundation web site: www.gilchristfoundation.com


RELATED CONTENT:

New Leadership Announcement from Young Fastener Professionals

IN THE NEWS with Fastener News Desk the Week of April 4th, 2022

Featured, Scholarships, Workforce / Skills Gap

Read more...